
Should we panic over this sea surface temperature plot?
Richard B. (Ricky) Rood
University of Michigan – Ann Arbor (Emeritus)
June 20, 2023
Recently, a sea surface temperature (SST) plot similar to the one here (Figure 1 and above) has been making the rounds through the media, both social and formal. The plot has been accompanied with words such a “unexplained,” “bewildering,” “alarming,” “depressing,” and “panic.”
My first response to this figure was that it was well within the range of what I would expect. Rather than panic, alarm, or debilitating, it would be more useful to deeply internalize this piece of information and then plan out what it means.
There are four reasons that I think the figure lies within expectations.
- Earth is accumulating heat, and we have not intervened in a way to stop that accumulation.
- That heat is being distributed throughout the planet; it is permeating the ocean, land, and ice.
- We have an El Niño which causes a “spike” in SST.
- The behavior is largely consistent with past events.
To add to the starkness of the appearance of the spike, we are coming off of three successive La Niña years, which tend to reduce the temperature of Earth. Hence, the El Niño signal might appear especially large.
I want to lay out the argument of why I do not find the SST spike especially surprising. Then, do a bit of analysis on the communication challenges that we have constructed for ourselves. Finally, why I say the right thing for us to do is to internalize this knowledge and think about what to do with it.
Context of the 2023 sea surface temperature (SST) “spike”
All of the figures are from the website ClimateReanalyzer.org.
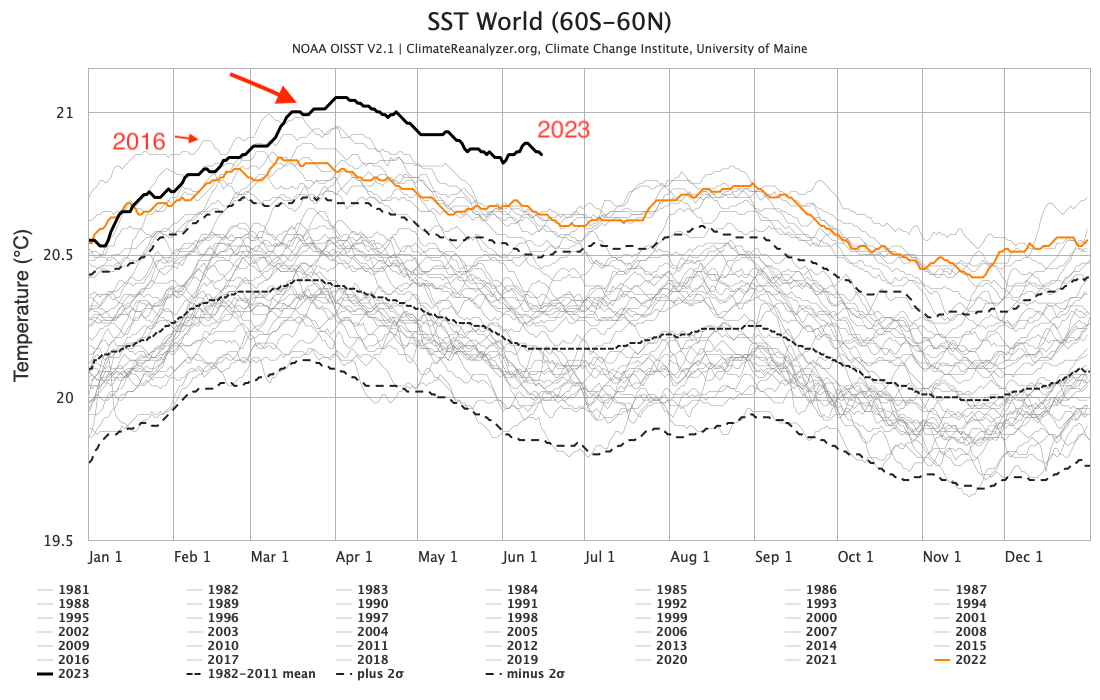
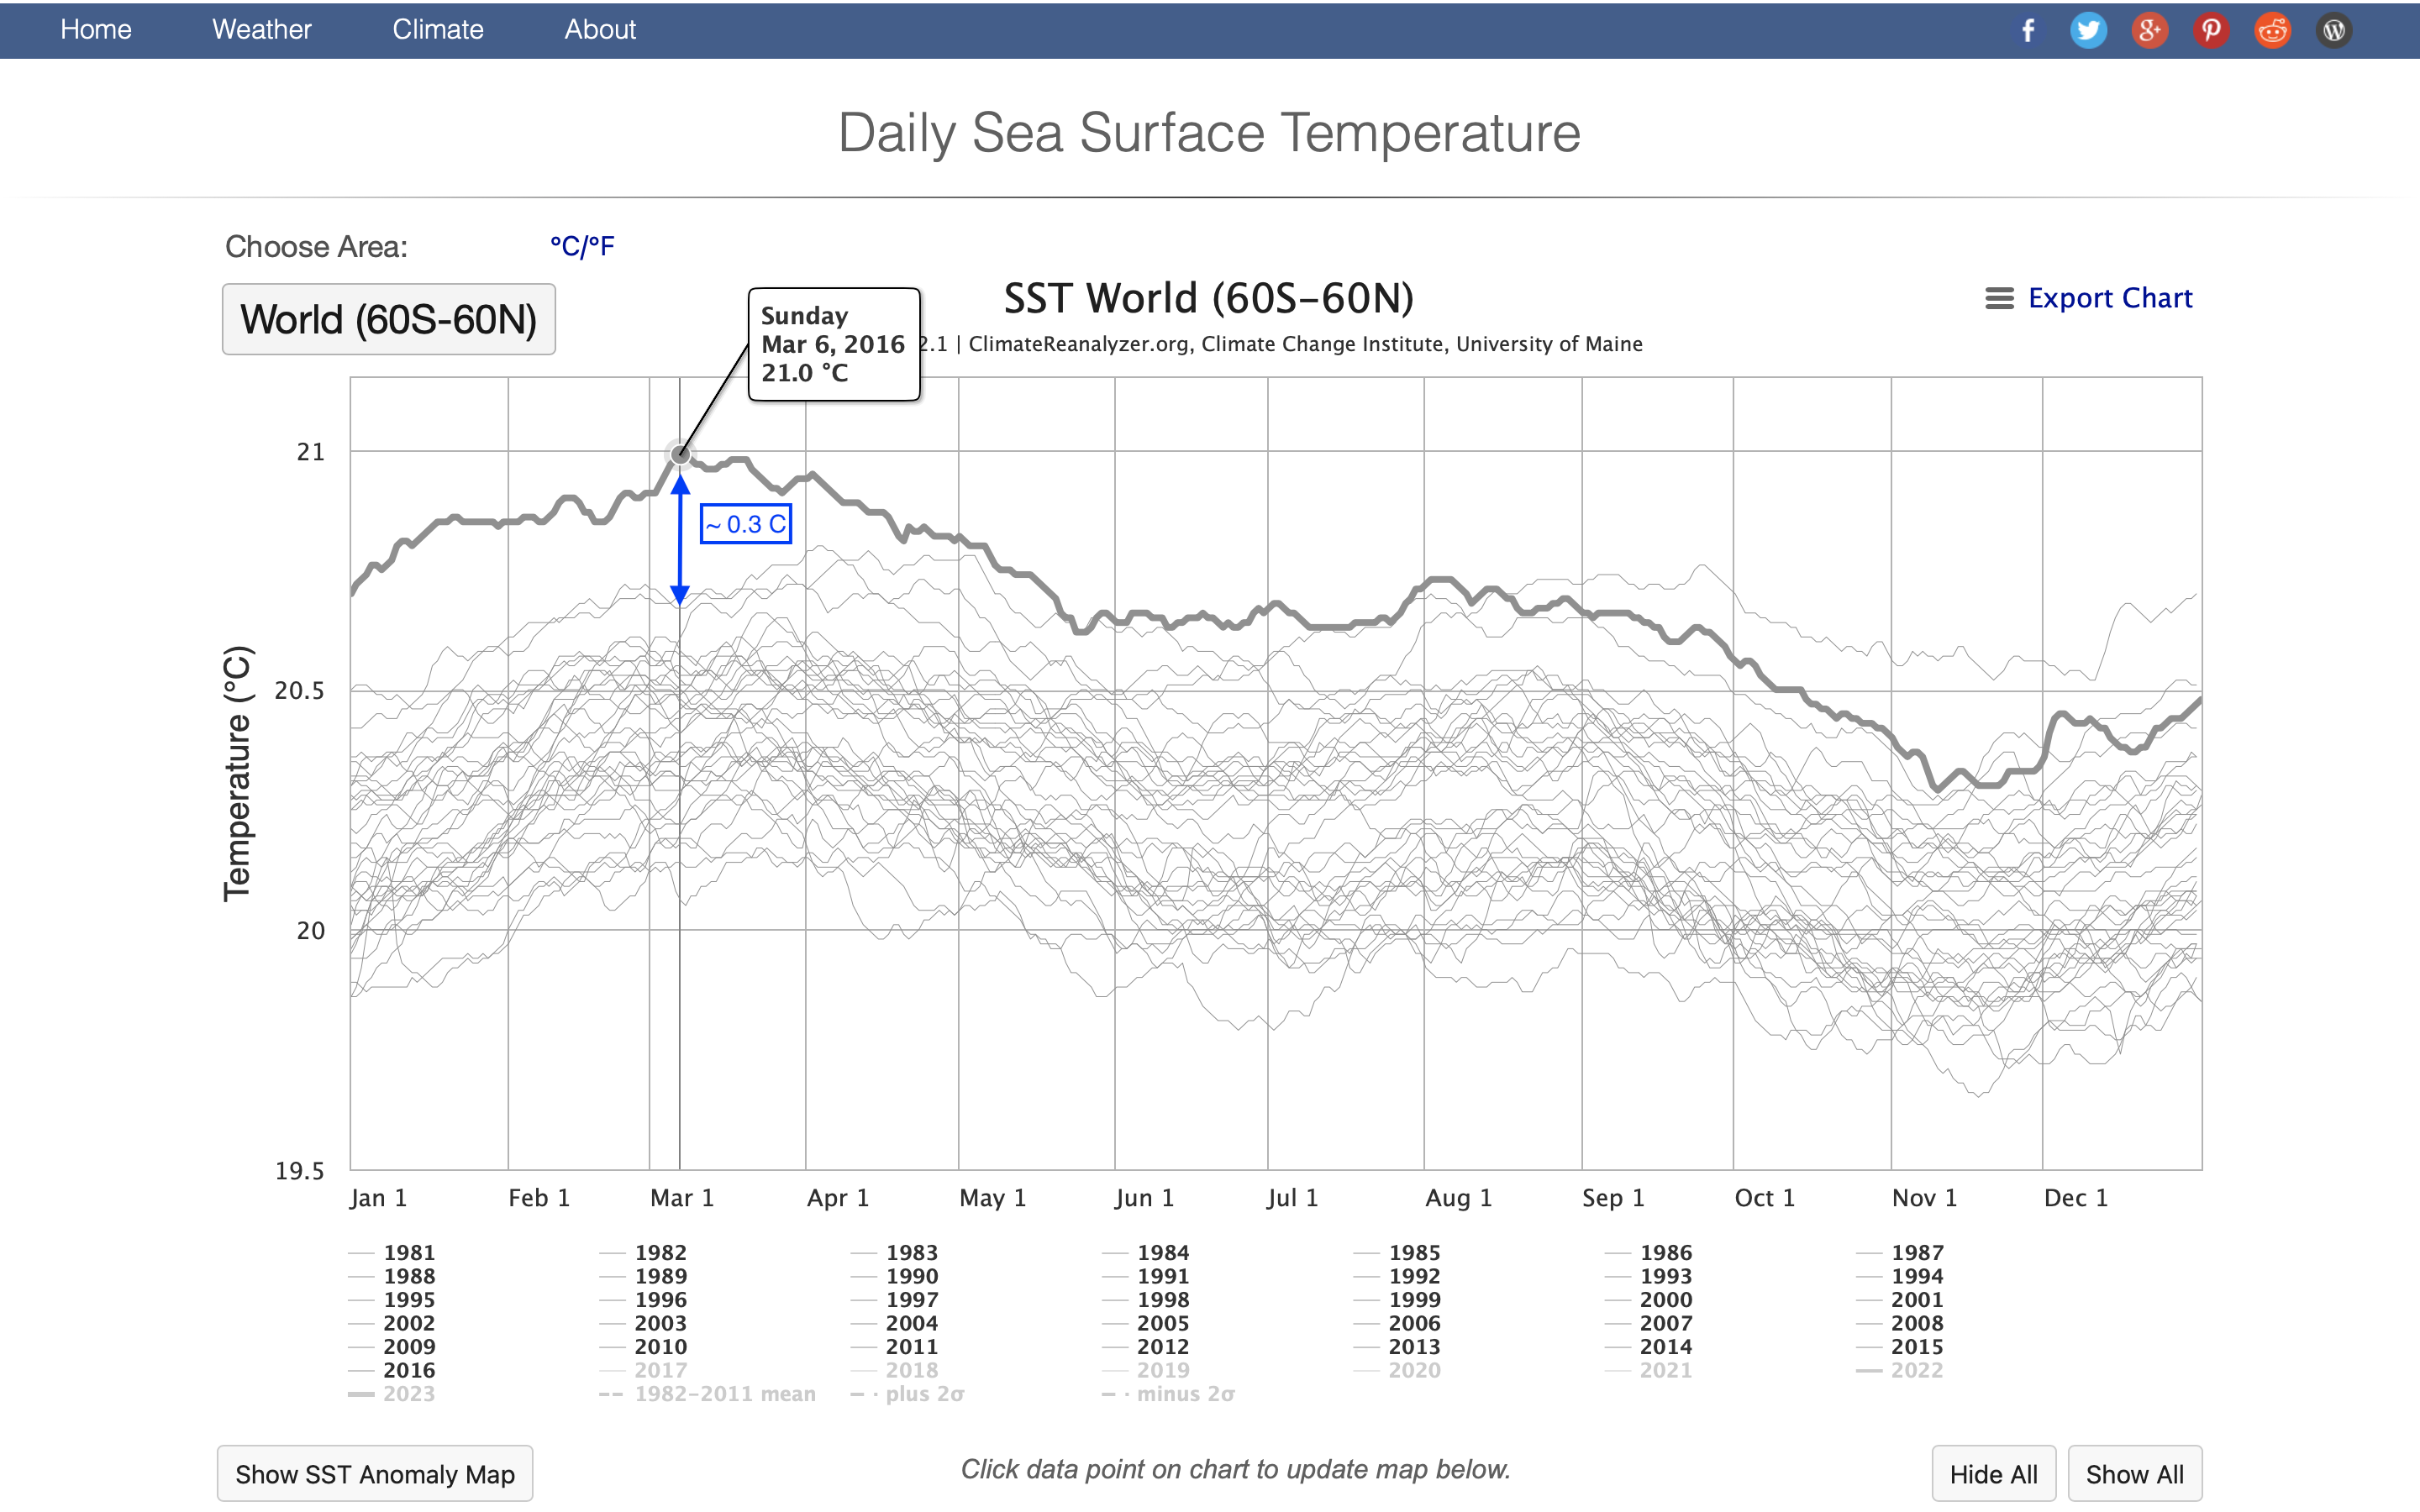
Figure 1: Sea surface temperature averaged from latitudes 60° S to 60° N for 1981 to 2023. Accessed at ClimateReanalyzer.org on June 16, 2023.
Figure 1 is an update of the figure that appeared in the Washington Post article, “Scientists are baffled why the oceans are warming so fast.” The update is because there are a few days more observations than when that figure was published. The bold line, the 2023 observations, comes off of a curve from an earlier time (large red arrow) and goes into uncharted territory. That earlier year is 2016, which is a previous year with an El Niño. Hence the current observations are exceeding a year already recorded as very warm.
If I choose June 10, then the difference between 2023 and the warmest years in the cluster of previous years is 0.2° C. (marked figure)
I want to look at the 1997 – 1998 El Niño. This was a large event that put a significant spike in the global surface temperature record. That spike was written about for the entire next decade, which will be discussed in the next section.
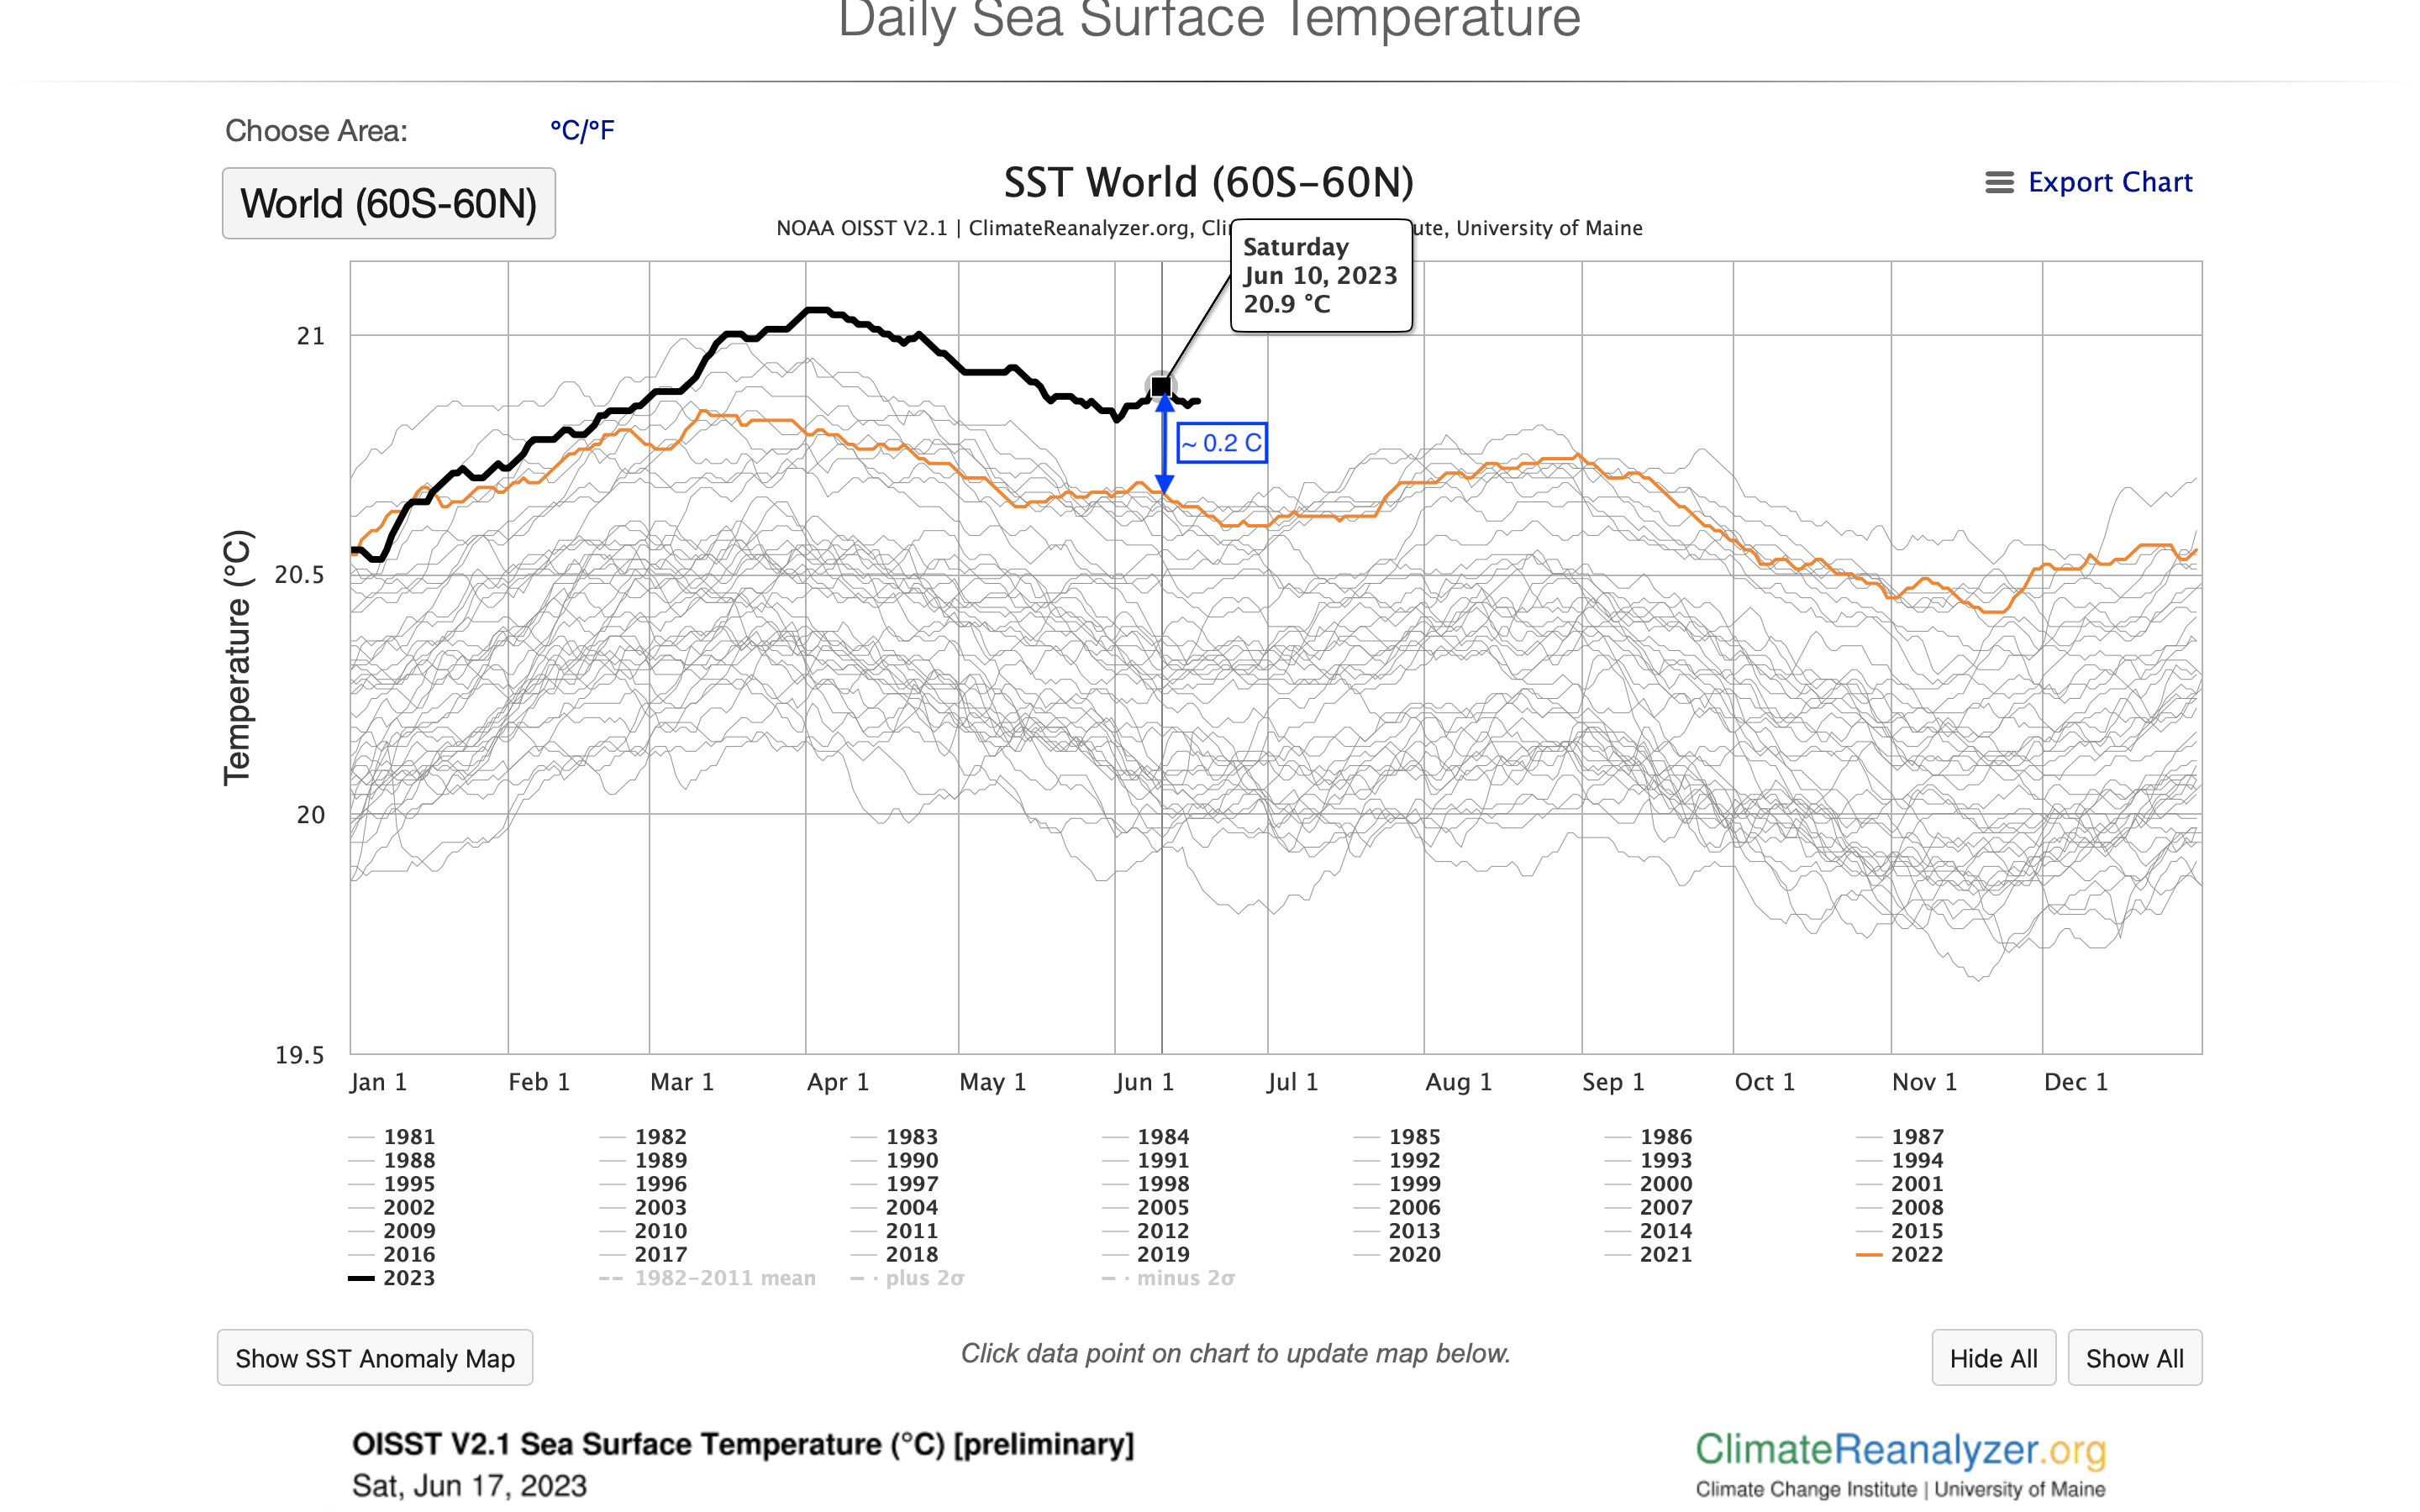
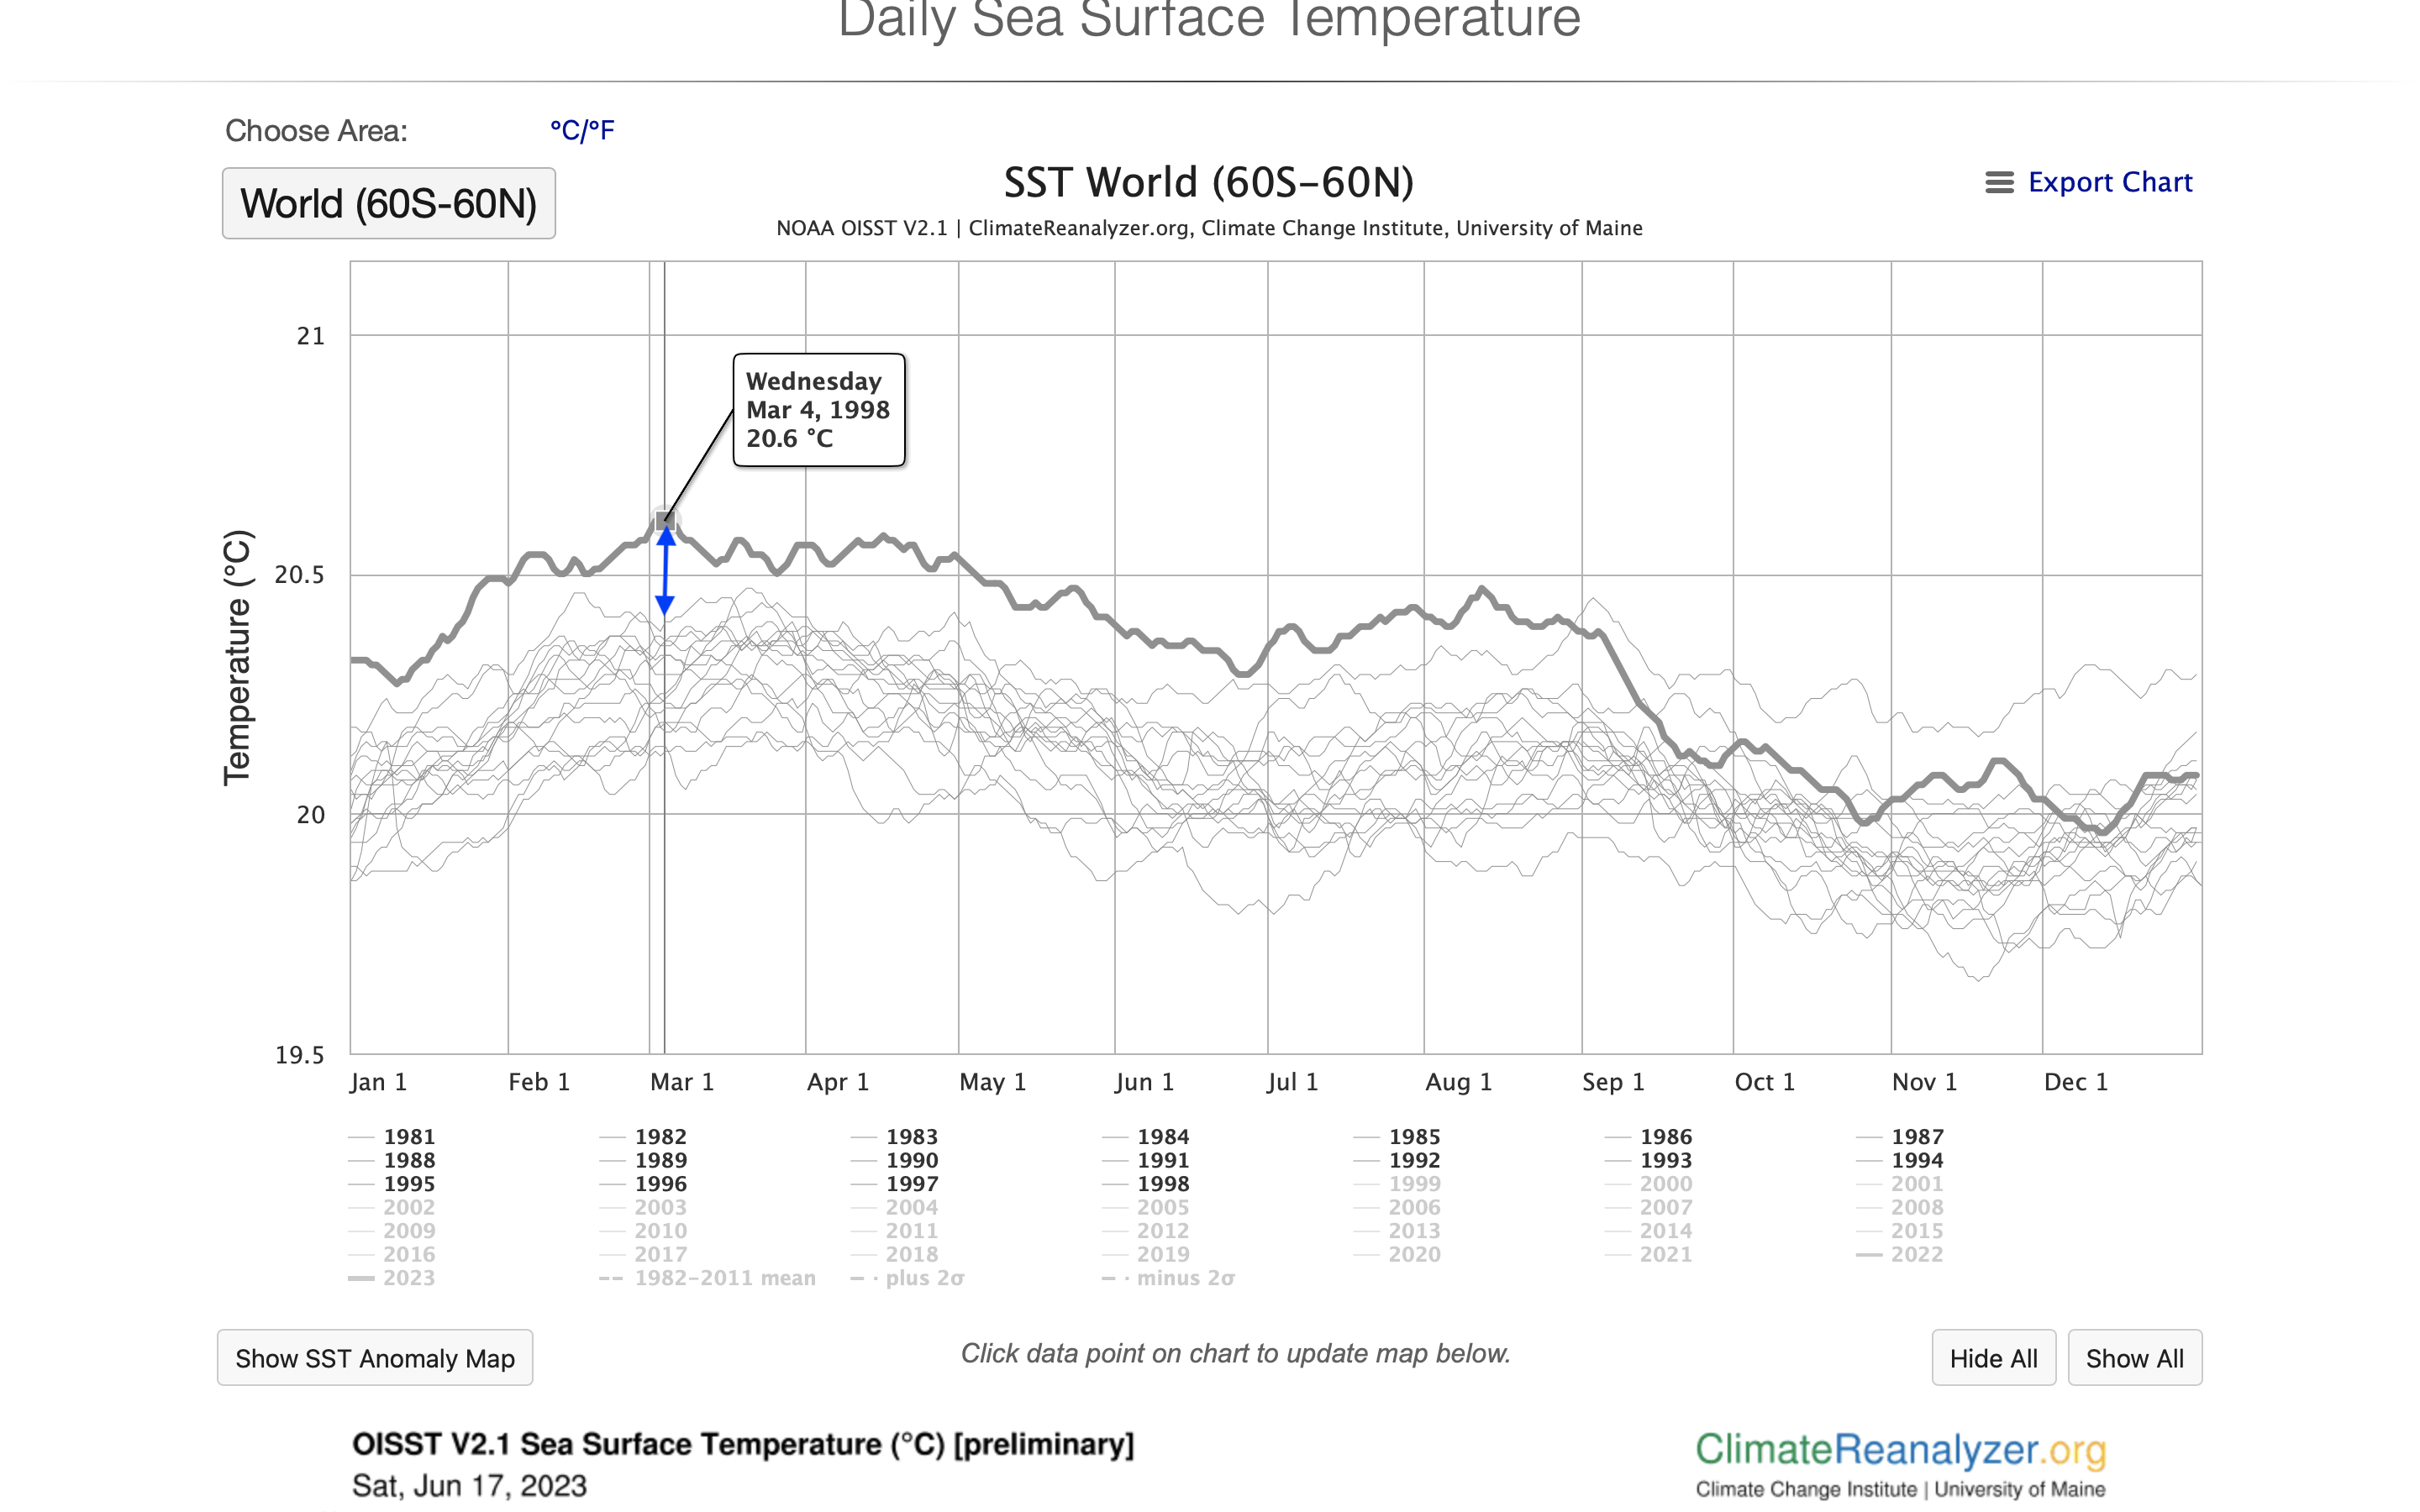
If I go to May of 1997 (Figure 2), at the start of the El Niño cycle, the 1997 SST takes off into uncharted territories compared to the previous years (red arrow). From May of 1997 until September of 1998, there are many times when the SST is 0.2° C above the observations prior to 1997. On September 3, 1997, the difference is approaching 0.3° C (blue arrow), as occurs numerous times in November and December. At its peak SST in 1998, March 4, 1998, the difference from the earlier years is 0.2° C (marked figure), the same as the June 10, 2023 value.
Figure 2: Sea surface temperature averaged from latitudes 60° S to 60° N for 1981 to 1997. Accessed at ClimateReanalyzer.org on June 16, 2023.
The El Niño of 2014 – 2016 has the same characteristics. At its beginning in 2014, the SST goes into previously unrealized values. In 2016, at its maximum value, the difference from the SST prior to the onset of the El Niño reaches 0.3° C. (marked figure)
In all cases, after the El Niño, there is cooling towards the cluster of previous years, with the cooling settling at SST values that are among the highest values in the, then, past record.
There is significant risk in taking short spikes in the SST temperature record and drawing conclusions before the event has formed and evolved. As the 2023 signal has started, it is consistent with past behavior.
From what has been observed so far, a number of conclusions can be drawn.
- At the start of an El Niño, the SSTs in these plots reach new highs.
- At least since and including 1997 – 1998, the large El Niño events have been 0.2° C or greater than the previous historical record.
- There is a positive trend in the temperature measurements. 1The SST is “nonstationary. Therefore, the mean and standard representation in Figure 1 are not accurate descriptions of the temperature distribution.
The El Niño events, therefore, serve as steps, and the temperatures are climbing to higher average values from one step to the next.
These figures are limited to 60° S to 60° N, in the ocean. We expect the effects of ocean warming will be realized in the atmosphere. Further, as heat is transported towards the poles, the warming temperatures will be realized at higher latitudes, and are expected to be amplified. Therefore, we expect global, systemic effects of the rising temperature.
Communication Challenges
For more than a decade I was the climate change blogger at Wunderground.com. In late 2014, I decided to quit writing about the monthly temperature records and how they ranked. We expected global temperature to rise, with some interannual variability.
It would be tiresome to write for decades about how hot it is getting. The real news would be a month that dropped below the 20th century average.
We should expect new record highs in new places every year. What is a large record this year, will be incorporated into updated “climatologies” in 10 years. Since the temperature is rising rapidly, these updated climatologies will be getting warmer and warmer.
As for framing a problem, panic and dismay of observations that are fundamentally consistent with what we expect is not a useful framing for tackling problem solving. In fact, if the observations fall into what we expect, it suggests confidence in the scientific research and the projections. It is an ingredient of actionable research.
Aside from this general framing, there are specific communication challenges that will follow from these observations.
- We will see the Earth exceed the 1.5° C global average during this El Niño. This should initiate a reckoning with the unrealistic policy goals of keeping the Earth below a 1.5° C threshold. This will come into conflict with the rhetoric that has emerged that we must reduce emissions by impossible amounts between now and 2030 to avoid climate catastrophe. This will challenge institutional credibility.
- The 1997 – 1998 El Niño was so large that it appeared as a distinct peak in the global average surface temperature record (discussed in this lecture). This peak was not realized again for several years. After the 1998 peak, the decline became fertile ground to grow the narrative that the temperature of Earth had peaked and global warming was a farce. It, also, fueled stories that climate scientists had used the El Niño peak to exaggerate warming. We should anticipate similar messaging. This is especially true if we express incredulity of the emerging temperature record.
Deeply Internalize These Observations
Though some might be motivated by framing global warming as a crisis or an emergency, this is not a broadly sustainable position. Framing global warming as a short-term crisis, with long-term catastrophic outcomes is a prescription for failure.
Taking each new piece of information and having it be mini-crisis or a mysterious new twist is not a productive way to address problems. It is the sign of anxious people, in an anxious system, and that leads to poor decision making and bad outcomes. Incredulity amplifies the political theater.
Climate change is not a problem of political will to implement a solution. It is rooted in our use of natural resources and the dependency of our economies on their continued use. Even in the most proactive, feasible scenarios to reduce emissions and adapt to climate change, we are in a world where people will have to learn to live in and with global warming for generations. We will have to work in and with the changing climate, adapting and reducing greenhouse gases as parts of our day-to-day behavior.
The knowledge provided by climate science and climate change projections is the foundation for action. When what we, in fact, project comes true, the response needs to be this is happening as we expect, and we need to be acting in a way to address the changes, manage the problems, in a ways that are solution focused.
(I thank Dan Brown and Prasad Kasibhatla for clarifying comments on the article.)