Template for thinking about river floods and flooding trends. A flood is not just a lot of rain.
What is this document?
This document is in development. It should always stand on its on, but it will be updated. The material is an unreviewed special collection to inform analyses and framing.
This is a set of resources on floods and their relation to a warming climate. It includes writings of mine and references supporting those writings.
The primary purpose of this document is to think about flooding trends, which require answering questions such as what type of floods are we talking about.
Assessments: The IPCC Report and the US National Climate Assessment
Assessments are lagging indicators of a warming climate.
Aside from the intrinsic difficulties of calculating trends in flooding, what is happening with floods is rapidly changing. Increases in extreme precipitation are well documented, with some of the greatest increases in the past decade.
Assessment reports often rely on peer-reviewed journal papers. Then these papers are synthesized in the assessment.
The research for a journal paper takes time and the review process takes time. It is often a multi-year process. Therefore, observations used in these papers often are not from the more recent years during which we observe rapid changes.
Then, the assessment of this body of research literature takes several years.
The assessments are, by the necessity of their protocol, lagging behind the changing climate.
Assessment reports are, therefore, lagging indicators of a changing climate. This becomes consequential when the climate is changing in, say, a 10-year time span.
The results of assessments have to be interpreted in context with changes that are unfolding in real time. Since we know the climate is not stationary, we need to be monitoring changes in statistics and the emergence of trends.
What the U.S. National Climate Assessment says about flooding
I start with the 2023 U.S. National Climate Assessment, which will also serve as an introduction to the complexity of flooding and flood trends. I extract text from three parts of the online presentation of the document.
From 25. Northern Great Plains
Text of “Flooding”
Precipitation changes do not have a one-to-one relation with flooding. Many factors influence floods, including short- and long-term antecedent moisture conditions, presence of frozen soils, snowpack accumulation, rain-on-snow events, storm tracks, and rainfall rates.36,37,38,39
The Missouri River transects the region through 10 US states and 28 Tribal territories and is emblematic of the complex intergovernmental relations that will become increasingly important under climate change.40 Record floods along the Missouri River and its tributaries in 2011 and 2019 caused evacuations, cost billions in damages,41 and created interstate closures. Research suggests that recent large floods were caused by natural variability within the system;42 however, model simulations suggest that climate change will reduce runoff in the upper Missouri basin.
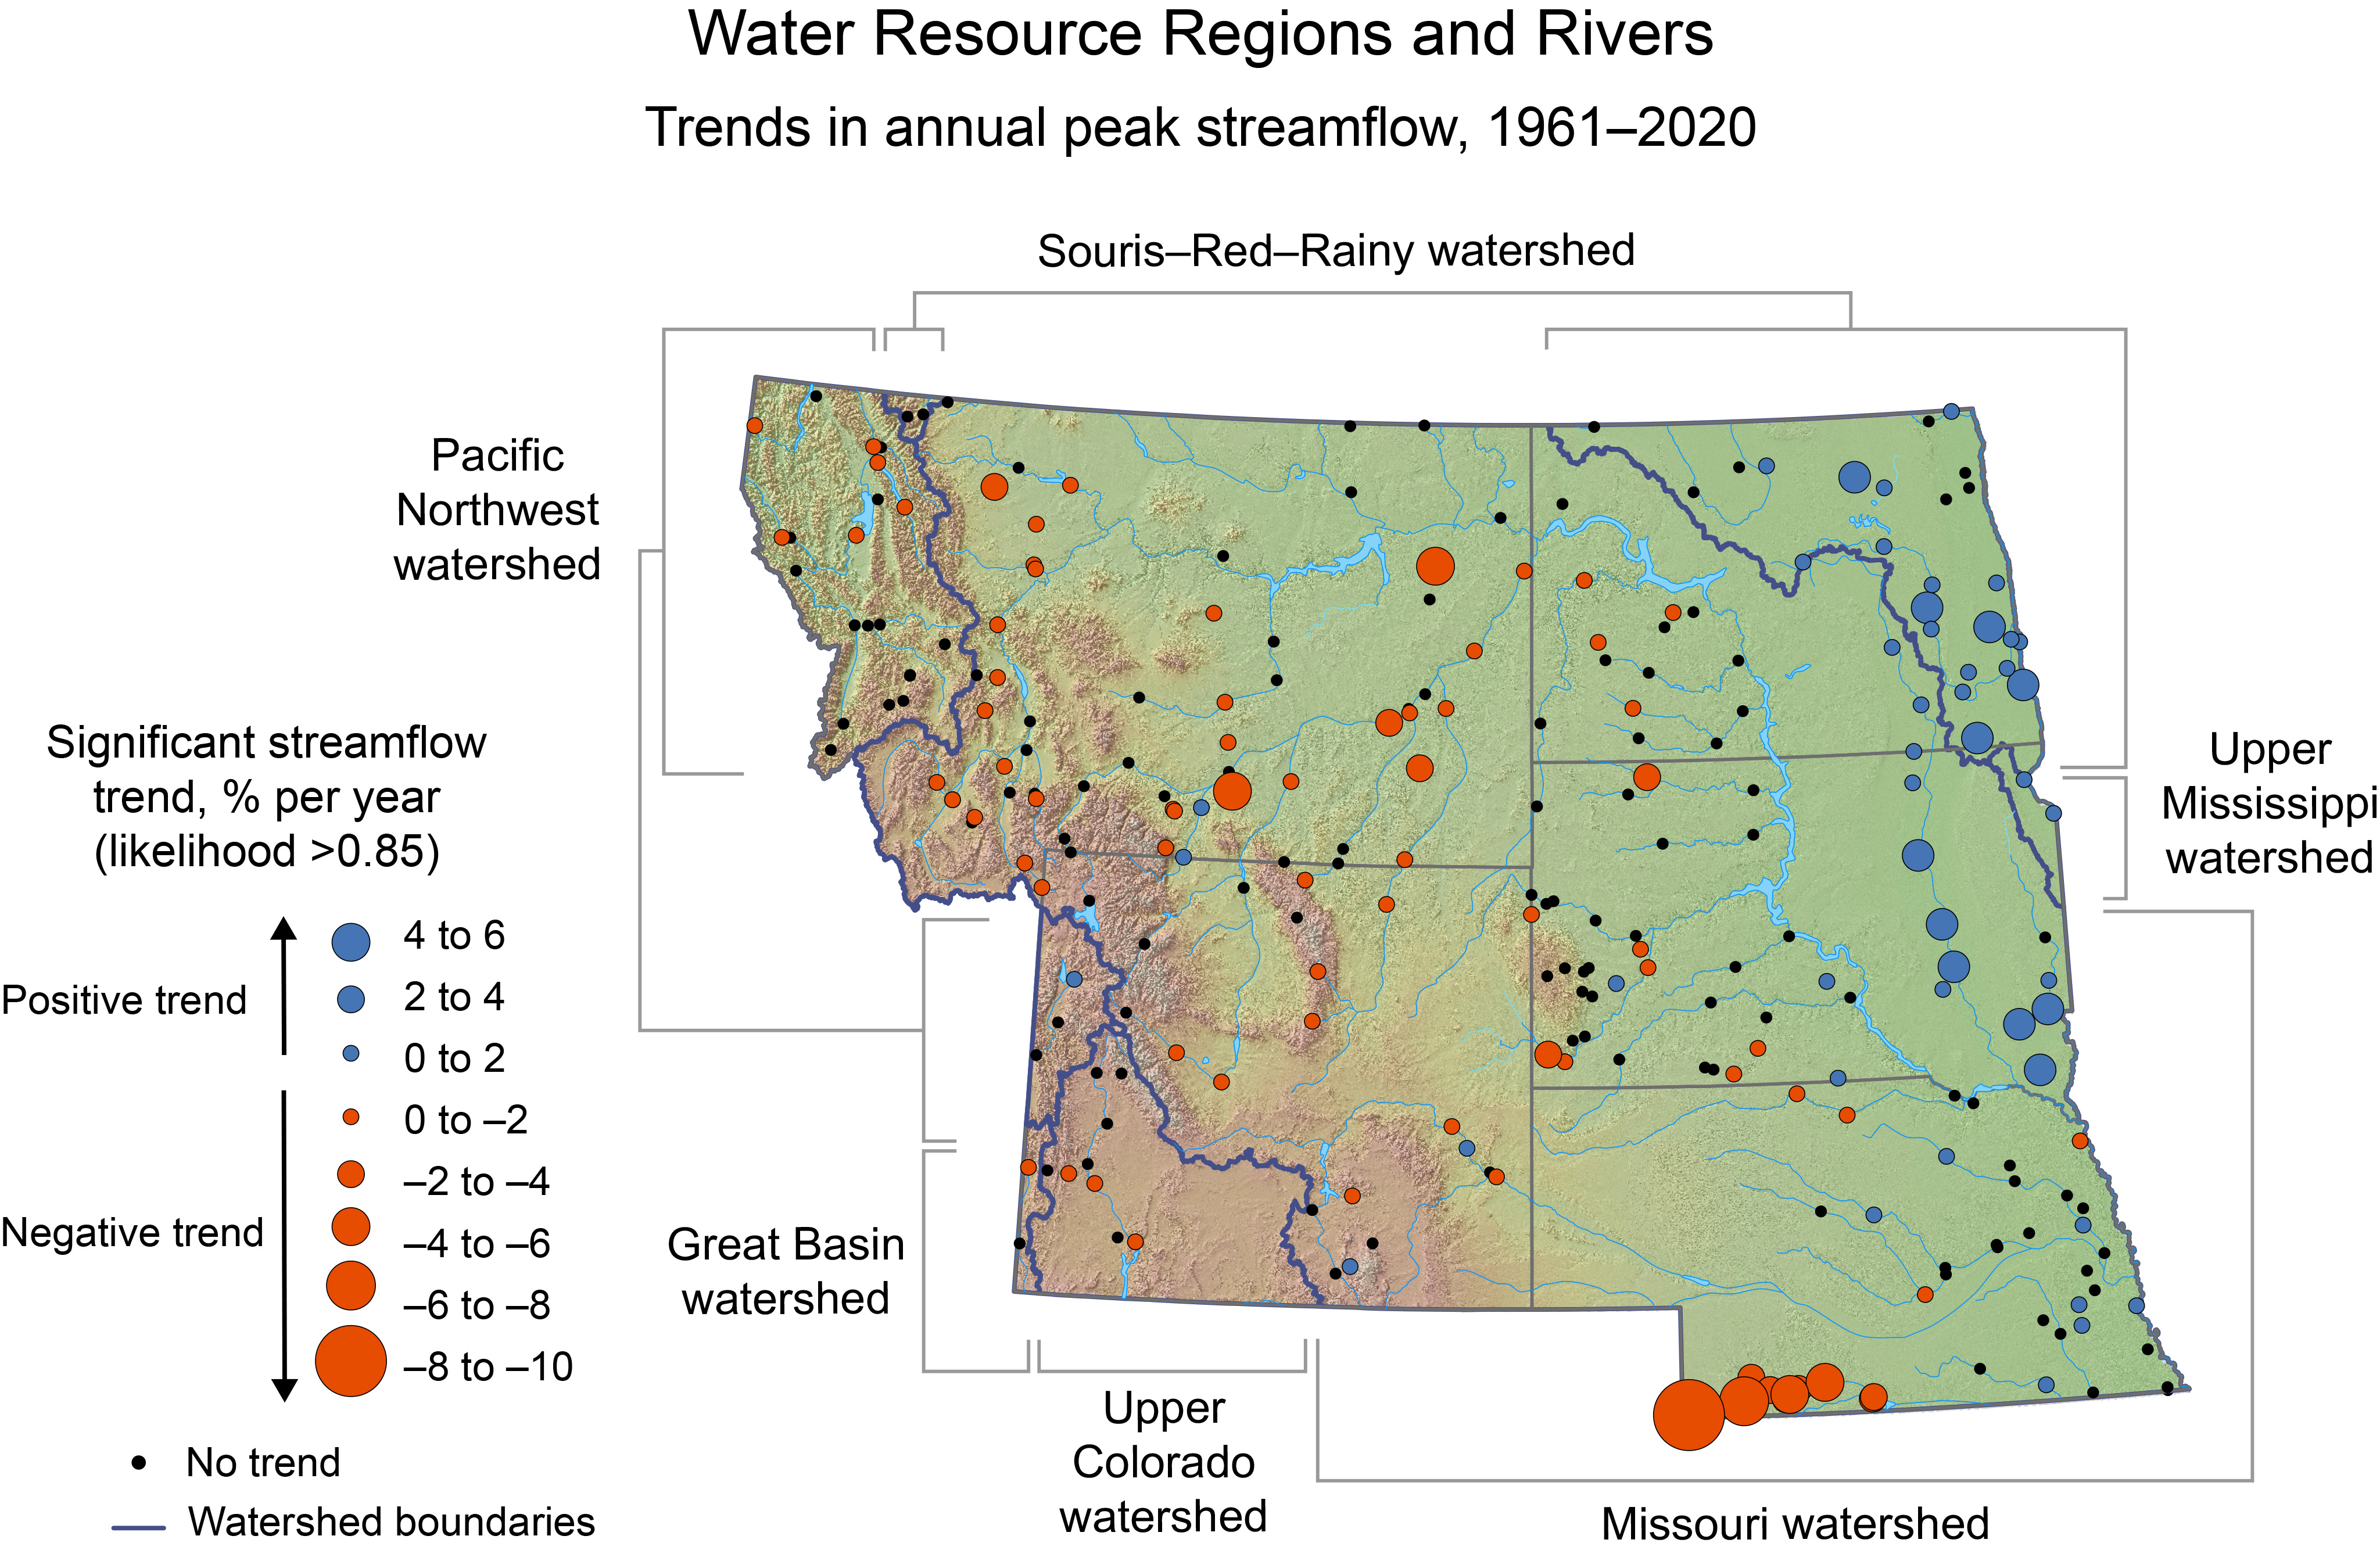
Trends in annual peak streamflow, a proxy for flooding, differ across the 100th meridian divide (Figure 25.4). Observations show that annual peak streamflow is decreasing in the west and increasing in the east.43 With few exceptions, the eastern Dakotas are an area of increasing peak streamflow (and flooding), while the western Dakotas, Montana, and Wyoming have decreasing peak streamflow. With 2° to 4°C (3.6° to 7.2°F) of global warming, the Northern Great Plains would expect to see some of the highest increases in annual flooding damage costs in the contiguous US due to climate change.44

Figure Caption: (Link to original image)
Annual peak streamflow—a proxy for flooding—has been rising in eastern portions of the region and declining in the west.
FIGURE 25.4. (NCA numbering) This map of the water resource regions and rivers within the region shows distinct east–west differences in trends in annual peak streamflow for 1961–2020, expressed as percent per year, where the size of the dot is relative to the size of the trend. Red dots are downward trends, and blue dots are upward trends. A likelihood-based approach is used to report these trend results. When a trend is identified, the trend likelihood value (likelihood = 1 – p-value/2) associated with the trend is between 0.85 and 1.0. In other words, the chance of the trend occurring in the specified direction is at least 85 out of 100. Smaller black dots are sites for which there were sufficient data for trend analysis but likelihood was less than 0.85; that is, these sites do not exhibit a substantial trend in either direction. Figure credit: USGS, NOAA NCEI, and CISESS NC.
The Key Message (NCA terminology) from this section on the Northern Great Plains is
Climate Change Is Compounding the Impacts of Extreme Events
The Northern Great Plains region is experiencing unprecedented extremes related to changes in climate, including severe droughts , increases in hail frequency and size , floods , and wildfire . Rising temperatures across the region are expected to lead to increased evapotranspiration , as well as greater variability in precipitation .
From this extract, I will take the following points.
- Peak streamflow is used as a proxy for flooding.
- It is not possible to attribute the record 2011 and 2019 Missouri River floods to a warming planet.
- There is attribution of increased streamflow in the eastern part of the Northern Great Plains domain, and decreased streamflow in the western part of the domain.
- e.g., Warming can increase or decrease stream flow. 1There is no one outcome.
- Changes in flooding are likely to be regional and ephemeral. Hence, the concept of averaging over space and time to develop statistics is not correctly representing the physical and geographical characteristics of changes of flooding.
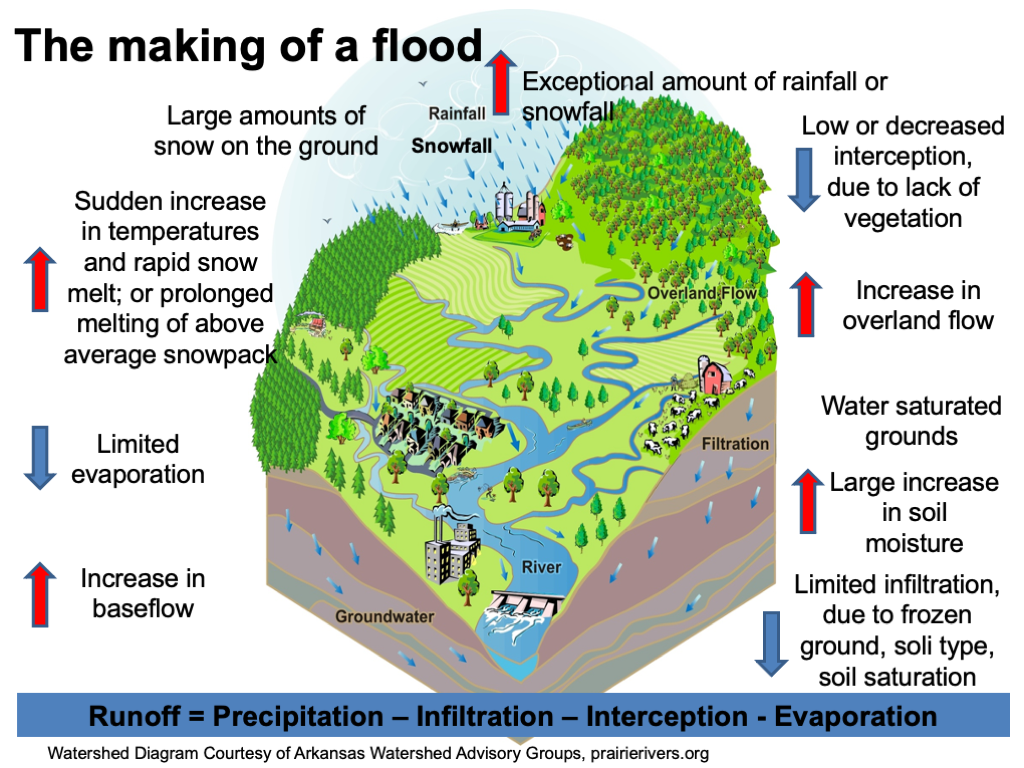
- As represented in the figure at the top of this article, there are multiple factors in the onset of a flood. Heavy precipitation is not the only one, and it is, in fact, not even necessary. 2for good analyses/discussion see Sharma_Precipitation_Extremes_Floods_WaterResourcesResearch_2018 & Wasko_Changes_Rainfall_Soil_Moisture_Flood_Trends_JHydrol_2019
A4.2. Atmospheric Indicators
Both globally and across the US, temperatures are rising as a result of increasing greenhouse gases (GHGs) in our atmosphere (Figures 1.5, 2.4), primarily caused by human activities (Figures 2.1, 3.1; KMs 2.1, 3.1). Extreme events such as heatwaves, heavy downpours, and severe flooding are also increasing in frequency and intensity (KM 2.2; Figures 2.8, 21.1, A4.8). Atmospheric indicators are used to inform decision-making across a wide variety of scales (Figure A4.1) and often form the basis for assessing trends, impacts, and key risks15 among all sectors.
Flooding
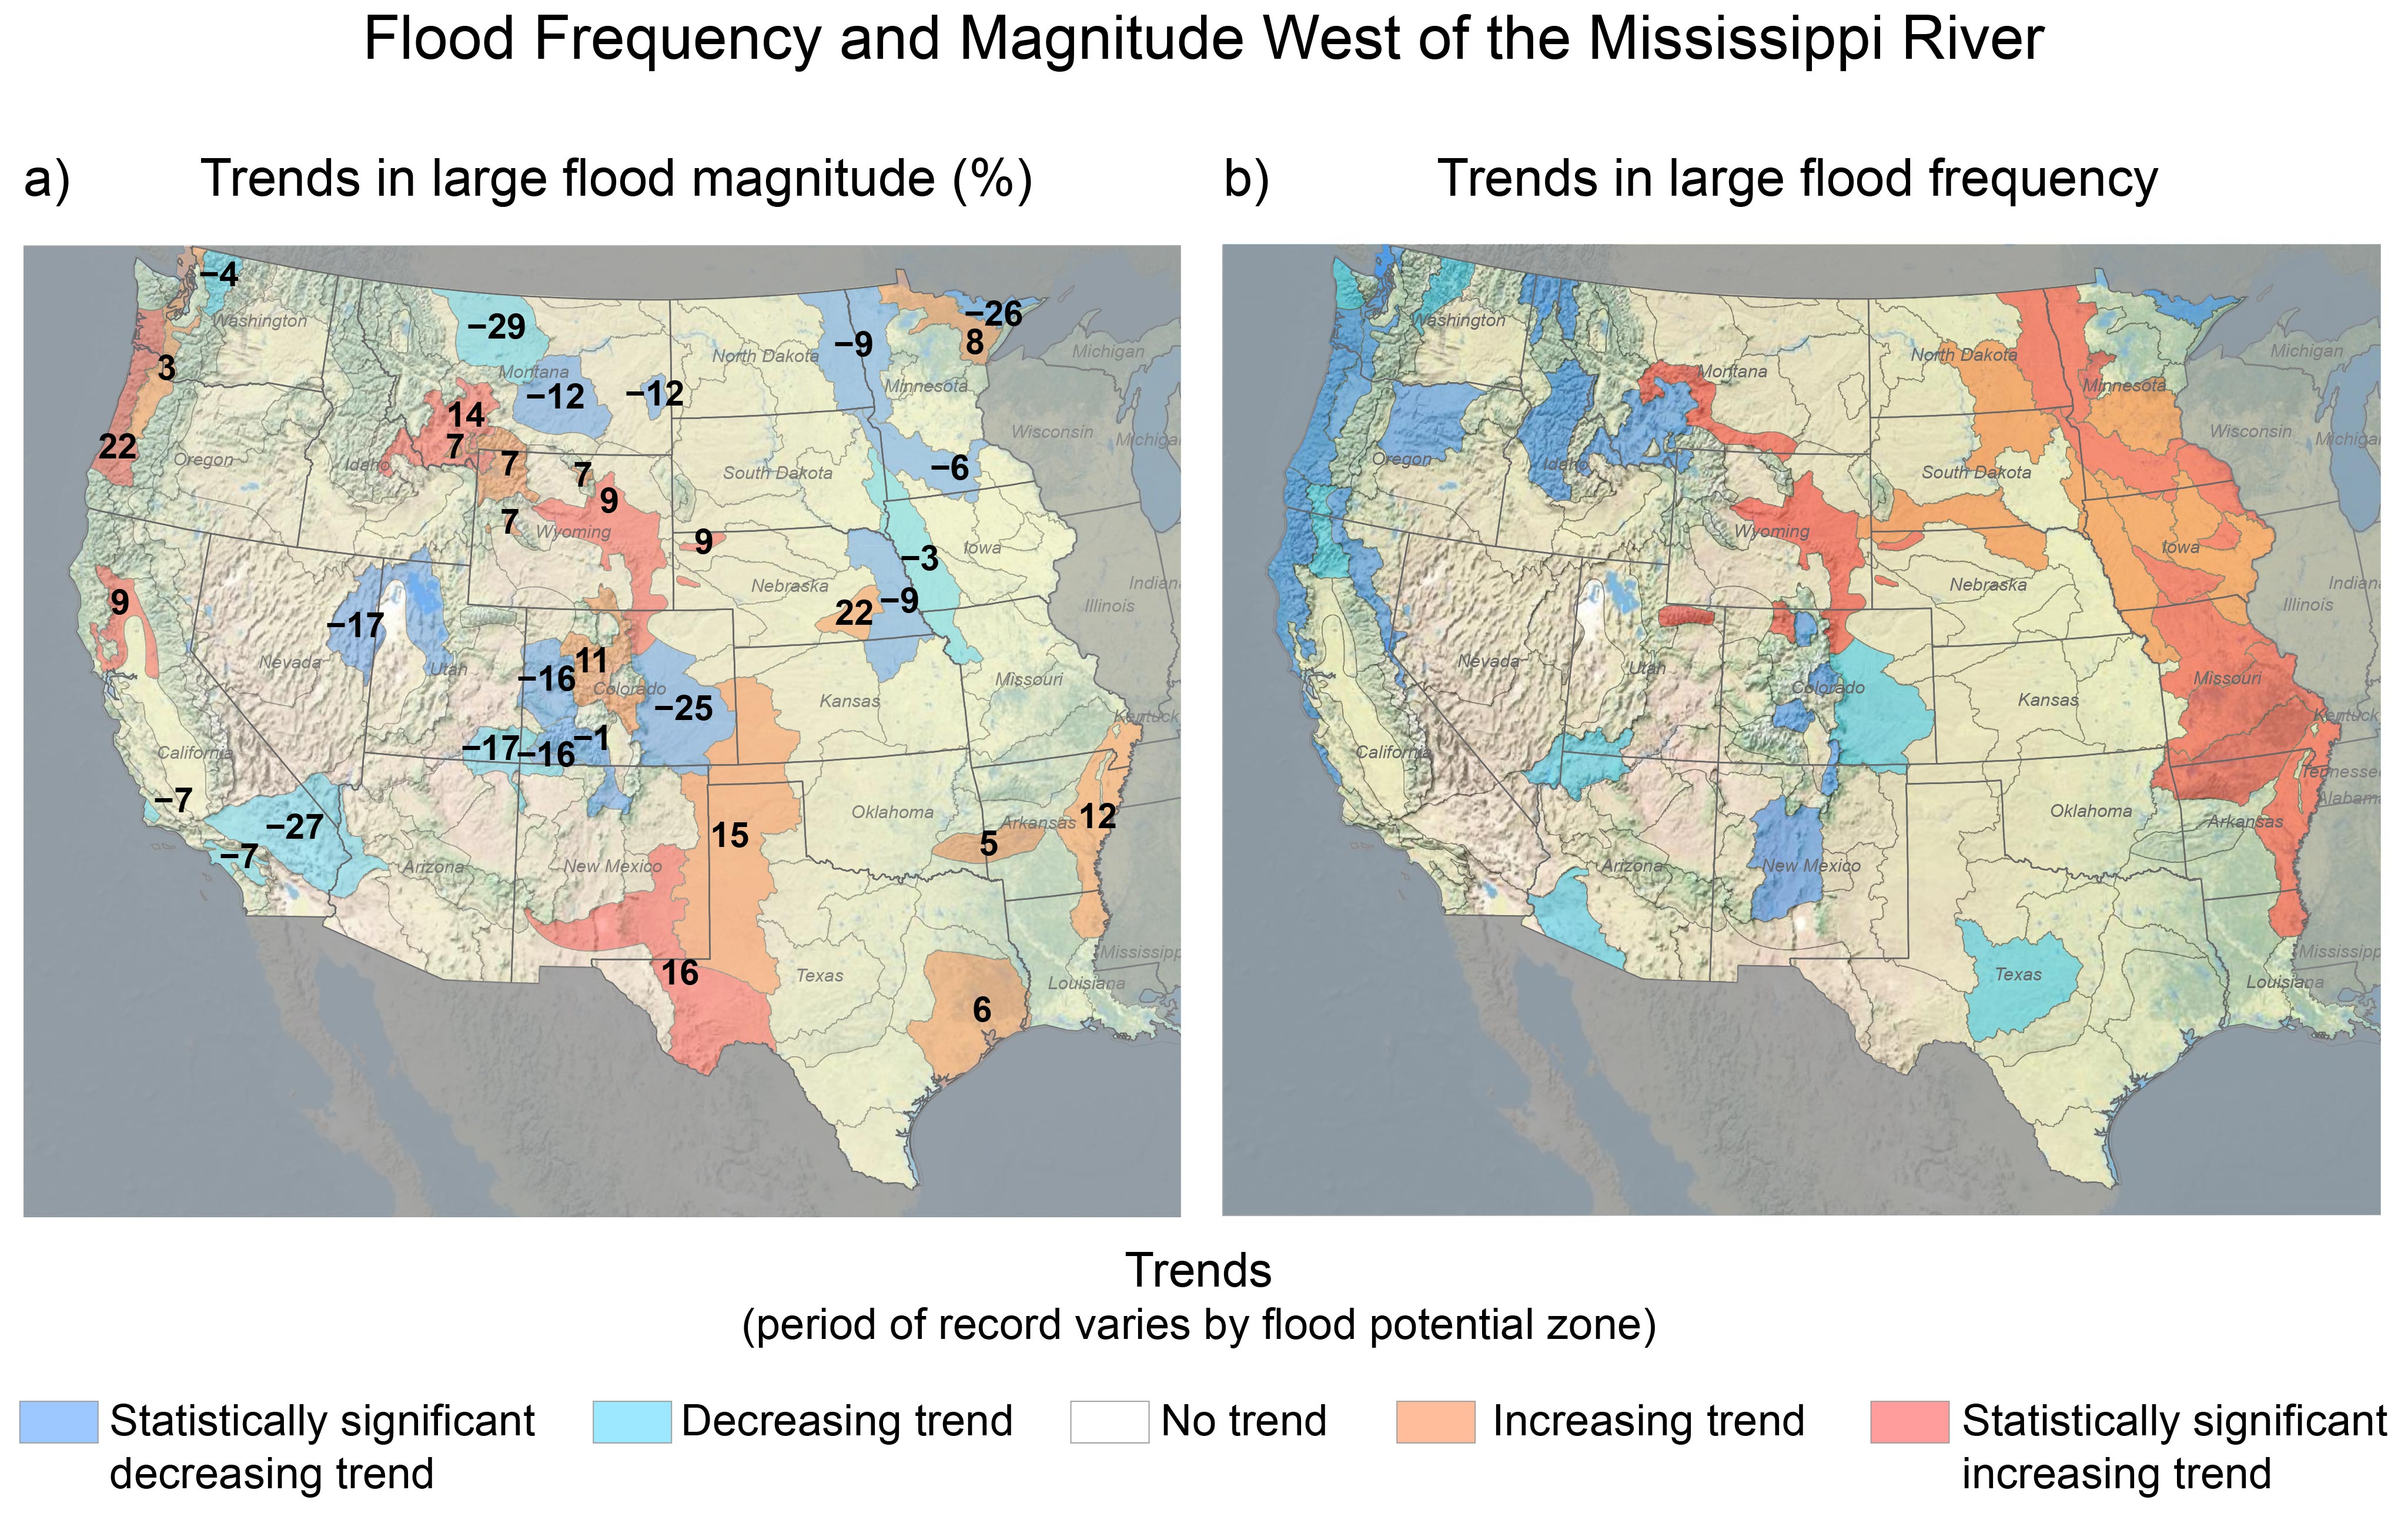
Indicators can be used to quantify trends in large floods, which is imperative for floodplain management and infrastructure design to maximize safety and resilience (KMs 4.2, 6.1, 12.4). For example, west of the Mississippi River, nearly 30% of monitored areas are experiencing increases in large flood frequency and/or magnitude (Figure A4.8). In contrast, other areas have recently experienced decreasing trends due to prevailing climate patterns such as the Southwest megadrought (KM 28.1).39 Flood indicators are also used to track economic damage related to flooding (Figure 4.12) and monitor flood trends of individual streams.40

Figure Caption: (Link to original image)
Trends in flood magnitude and frequency vary widely across the western US.
FIGURE A4.8 (NCA numbering). Flood magnitudes are increasing along the Oregon coastline, throughout large portions of the central Rockies and southern Great Plains, and in parts of the Gulf Coast, whereas flood frequencies are increasing across a large area east of the Rocky Mountain Front.41This indicator shows trends in (a) magnitude and (b) frequency of large floods in the western US within 117 flood potential zones. Shading in warm colors (reds) represents increasing trends, and shading in cool colors (blues) represents decreasing trends. Darker shades indicate where trends are statistically significant. (a) Percent change in annual flood magnitudes is indicated by black numbering. Trends in magnitudes vary by the available record length (most commonly from the early 1900s through 2020), while (b) trends in frequency are for 1945 to about 2020. Data are not yet available for the US Caribbean, Alaska, or Hawaiʻi and US-Affiliated Pacific Islands regions, as well as the contiguous US east of the Mississippi River. Additional information related to trends in large floods is provided in the Flood Potential Portal at https://floodpotential.erams.com/. Figure credit: USDA Forest Service.
A4.4. Ocean and Coastal Indicators
Sea Level Rise and Coastal Flooding
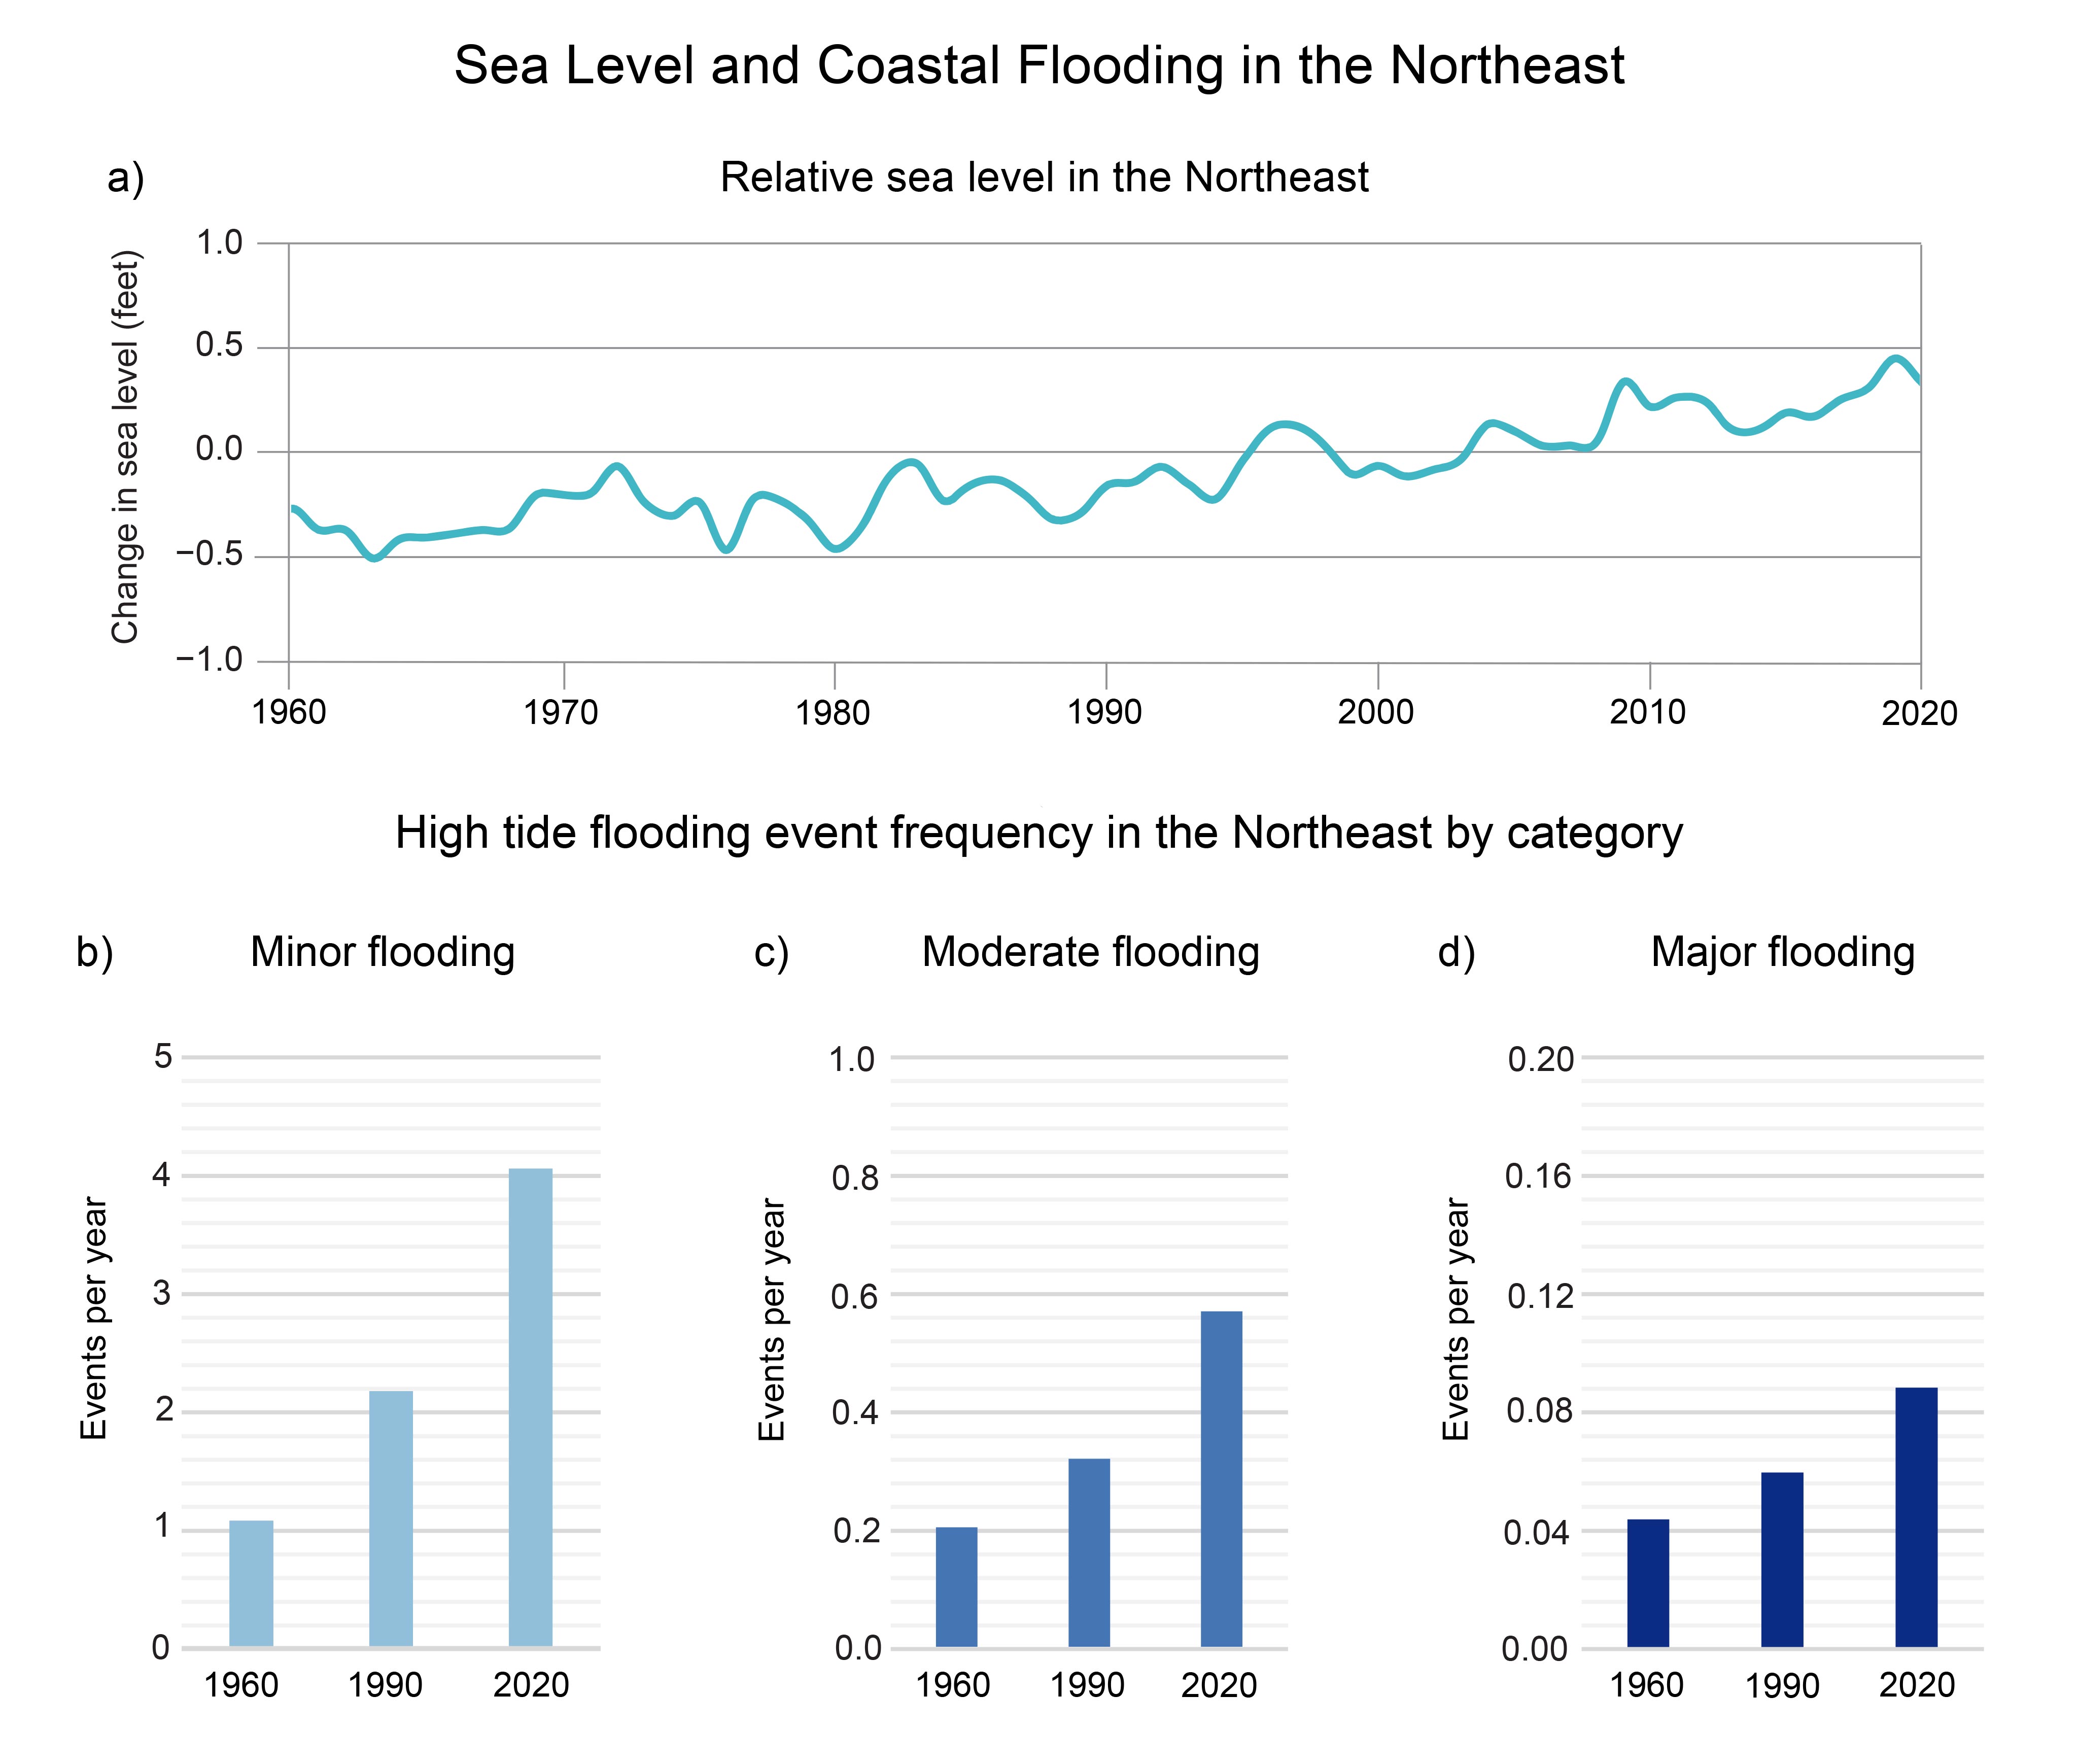
Global sea level is rising as warming ocean waters expand and glaciers and ice sheets melt. Along some US coastal areas, sea levels are rising faster than the global average, with the highest rates occurring along parts of the Atlantic coast and the Gulf of Mexico (Figures A4.10a, 2.5; KMs 21.2, 22.1, 26.1).46 The increase in relative sea level is driving increases in physical and societal impacts such as high tide flooding (Figure A4.10b–d; KM 9.1).

Figure Caption (Link to original figure)
The combination of rising sea levels and the increased frequency of coastal flooding events exacerbates risk for coastal communities.
FIGURE A4.10. (NCA Numbering)
(a) The line chart shows the observed changes in relative sea level from 1960 to 2020 (compared to the 1991–2009 average), which is a combination of sea level changes and local uplift or subsidence of land, averaged along the Atlantic coast of the northeastern US. The bar graphs depict the frequency of (b) minor (disruptive), (c) moderate (damaging), and (d) major (destructive) high tide flooding events at 30-year intervals (1960, 1990, and 2020), also for the northeastern US (see Figure 9.3 for definitions of high tide flooding thresholds). The frequency of occurrence is expressed as the number of events per year, where a value of 0.1 is equivalent to a 10% annual chance of experiencing that type of flood event. See Chapter 9 for contiguous US data, including future projections. Figure credits: (a) adapted from Sweet et al. 2022;47 (b, c, d) NOAA NCEI and NOAA.
From this extract, we will take the following points.
- There are different types of flooding, for example river flooding, coastal flooding, storm surges, etc. Trend detection is conditional to the type of flooding. 3for example, pluvial, fluvial, and coastal (Abegaz_History_Causes_Trends_Floods_United_States_NaturalHazards_2024)
- There are different measures of flooding, for example, areal size of flood, depth of flood, frequency of flood. Any or all of these could change with a warming climate.
Rainfall Is Becoming More Extreme
Since the 1950s, there has been an upward trend in heavy precipitation across the contiguous US (Figure 2.8).25 This increase is driven largely by more frequent precipitation extremes, with relatively smaller changes in their intensity. The largest increase in the number of extreme precipitation days (defined as the top 1% of heaviest precipitation events) has occurred over the Northeast (an increase of around 60%) and Midwest (around 45%), along with increases of more than 10% in their annual and 5-year maximum amount (Figure 2.8). These changes have contributed to increases in river and stream flooding in these regions.123,124 The increase in frequency and intensity of precipitation extremes is evident across a broad range of event durations (from 1 to 30 days) and return intervals (1 to 20 years), particularly east of the Rocky Mountains.125
Average Recurrence Intervals (ARI) and Floods
The average recurrence interval (ARI) is how often does a storm of a given magnitude return. A 1-in-100 year storm is expected once ever 100 years. This is often interpreted as a 1% chance in any individual year.
One of the most robust signals of our warming climate is the increase in extreme precipitation. It is straightforward physics that in an environment with an abundance of water, when the atmosphere and the surface warm up, there is increased evaporation. The atmosphere contains more water vapor. When the conditions are right for rain, the likelihood of large amounts of water falling in a short amount of time is increased.
This type of flash flood has captured people’s attention.
It is a type of flood that, with little ambiguity, follows from extreme rainfall. The depth of the flood waters and the areal extend will depend on, for example, the ability of the soil/surface to absorb water; however, the onset of the flood followed from excessive rainfall.
Flood Collection: Average Recurrence Intervals (ARI) Trends investigates this more thoroughly.
An Inland Hurricane Scenario
Hurricanes and tropical storms causing flooding and wind damage 100s of miles from the coast are frequent enough and cause enough damage, that they should be part of scenario planning for disaster preparedness in most of the eastern half of the U.S. The consequences of these events are enormous. As with all weather events, they now exist in a warmer and warming world, and that increases the imperative to walk through the plans for preparedness and response. That is they are part of the trend in Average Recurrence Intervals.
Flood Collection: An Inland Hurricane Scenario frames an inland hurricane more thoroughly.
Western North Carolina 2024 flood (Asheville)
Turning to 2024 in Western NC and the remnants of Hurricane Helene, the area of the rain and floods is 1000s of square miles in several states. It is hilly and mountainous. All types of built environments are present. There is storm infrastructure, as well as many dams built for both hydropower and to manage extreme precipitation.
Flood Collection: Western North Carolina 2024 flood (Asheville) is an analysis of the flood as an exercise in scenario development.
Flood References:
These references are meant to be representative, not comprehensive. Often they provide entrée into a subject area.
Abegaz_History_Causes_Trends_Floods_United_States_NaturalHazards_2024
Archfield_Fragmented_patterns_flood_change_United States_GRL_2016
DeGaetano_Changes_Average_Recurrence_Interval_ARI_JAppMeteorolClim_2022
Goffin_Intensification_Wettest_Days_Europe_GRL_2024
Sharma_Precipitation_Extremes_Floods_WaterResourcesResearch_2018
Wasko_Changes_Rainfall_Soil_Moisture_Flood_Trends_JHydrol_2019
Inland Hurricane Flood References:
Pictures of Agnes from Virginia Places
National Weather Service: Agnes Summary
Axios: 50th Anniversary of Agnes
Virginia Floods of 1969: (Camille)
Rapid Reaction: Historic Flooding Follows Helene in Western NC
Intensification of Hurricane Sandy (2012) through Extratropical Warm Core Seclusion
Impact extremely warm Gulf Stream / heavy precipitation / Hurricane Sandy / extratropical transition
Topic Outline (to be done)
Rood’s publications and interviews
Rules and Tools for thinking about flood trends.
From the IPCC Report
Routine storms on saturated water.
Trends in agricultural floods in spring.
