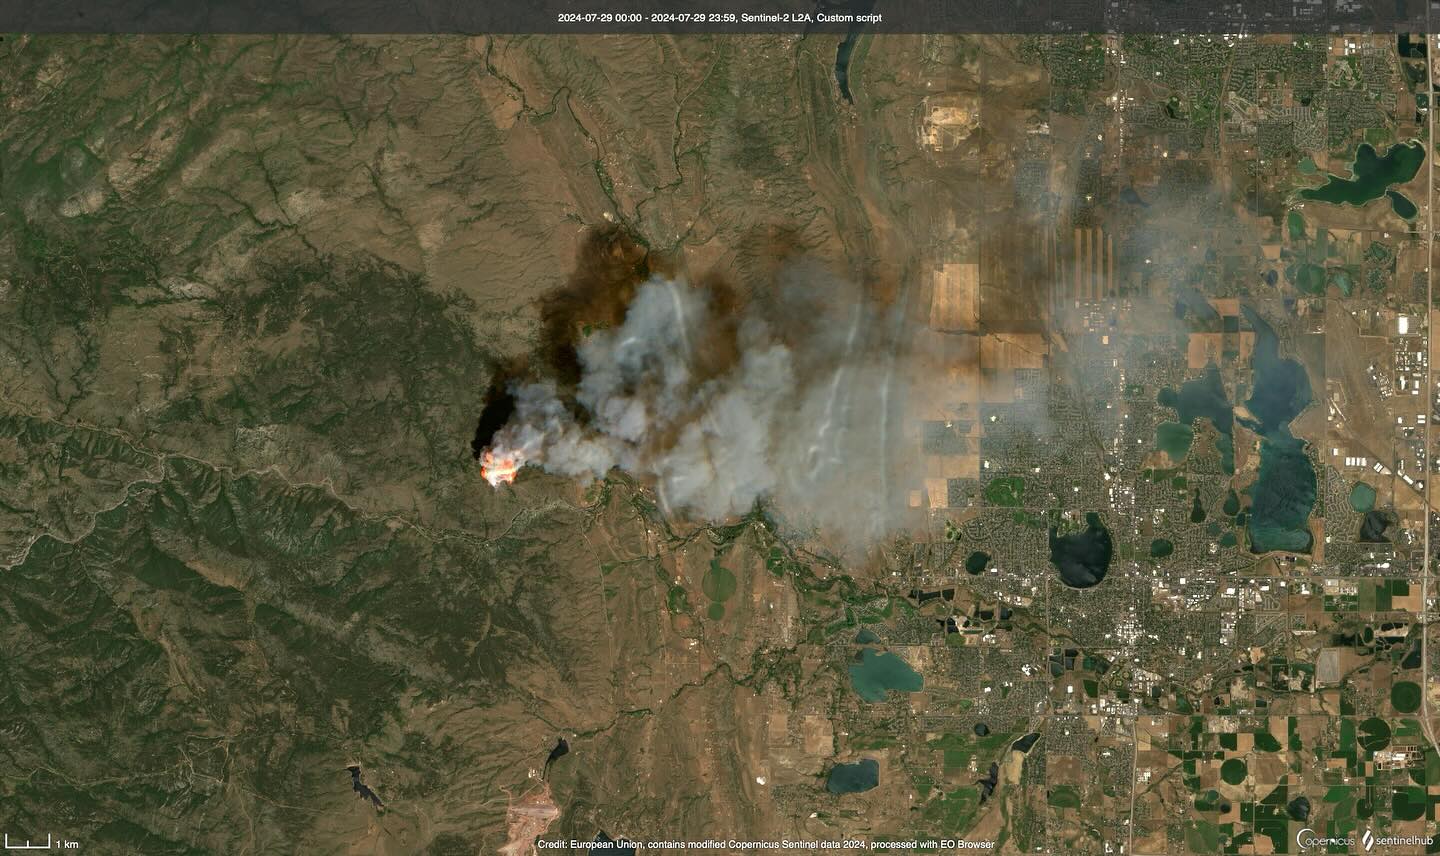
Alexander Mountain Fire, July 2024, Loveland Colorado. Imagine from Sentinel-2 Satellite. Posted by Tom Yulsman to Facebook.
What is this document?
This is a set of resources on wildfire and its relation to a warming climate. It includes writings of mine and references supporting those writings. There is also a collection of U.S. and Canadian websites that are essential to knowing what is going on with drought and fire. I have included extracts from the IPCC AR6 reports so you can read what the IPCC does, in fact, say about wildfire.
Rood’s Articles and Interviews on Fire and Fire Experiences
Rood’s Articles
- The normalizing of fire season
- Adding fuel to the fire
- ‘Do not breathe’ is not a good plan
- We need human learning more than machine learning
- Are we really talking about the weather?
- Fires in Colorado
Rood’s Interviews
- Wildfires and Climate Change: Michigan and Canada (Link to full show: Fire segment starts at 15:07)
- Live Interview Maui Fires
- Detroit Health Department slow to warn residents about wildfire smoke
- Be careful out there: Toledo air quality compromised by wildfire smoke (purchased pdf )
- Politics and climate change science class as West Coast wildfires rage
Wildfire Sites
National Interagency (Fire) Coordination Center
CFFDRS: Fire Weather Index FWI System
Climate Change Indicators: Wildfires (EPA)
Canadian Interagency Forest Fire Center
FIRMS US/CANADA (Fire Information for Resource Management System US/Canada)
Smoke Forecasts
HRRR is a US Regional Model with short-term forecasts (~2 days)
HRRR: Smoke graphics (HRRR: Users Guide)
Global Fire Monitoring (Copernicus)
NASA: GMAO: Air Quality Forecasts
Drought Monitors
North American Drought Monitor
Fire References
- Elements of Fire (Smokey Bear)
- Climate change more than doubled the likelihood of extreme fire weather conditions in Eastern Canada
- Increasing Large Wildfire in the Eastern United States
- Invasive grass fuel loads suppress native species by increasing fire intensity and soil heating
Satellite Imagery
NOAA: Satellite andProduct Operations:Fire and Smoke Product
NASA: EarthData: Smoke Plumes
Some fires in the news
- Fire: Jasper, Alberta (July 2024)
- Fire: Texas Grass Fire (2024)
- Winter/Spring 2024 Grass Fires Michigan (1)
- Winter/Spring 2024 Grass Fires Michigan (2)
- Fire: Lahaina, Hawaii (August 2023)
- Fire: Eastern Canadian Wildfires (2023)
- Fire: Marshall (Louisville, & Superior, Colorad0, 2021)
- Wildfire threat is growing in America. Just look at Kansas.
IPCC: What does the IPCC say about wildfire?
The primary entry on wildfire in the IPCC Report is in
Working Group II: Chapter 2 (Terrestrial and Fresh Water Ecosystems and Their Services)
Here is reproduced, with likely formatting errors, the section
P243-246: 2.4.4.2 Observed Changes in Wildfire
2.4.4.2.1 Detection and attribution of observed changes in wildfire
Wildfire is a natural and essential component of many forest and other terrestrial ecosystems. Excessive wildfire, however, can kill people, cause respiratory disease, destroy houses, emit carbon dioxide and damage ecosystem integrity (see Sections 2.4.4.2 and 2.4.4.4). Anthropogenic climate change increases wildfire by exacerbating its three principal driving factors: heat, fuel and ignition (Moritz et al., 2012; Jolly et al., 2015). Non-climatic factors also contribute to wildfires—in tropical areas, fires are set intentionally to clear forest for agricultural fields and livestock pastures (Bowman et al., 2020). Urban areas and roads create ignition hazards. Governments in many temperate-zone countries implement policies to suppress fires, even natural ones, producing unnatural accumulations of fuel in the form of coarse woody debris and high densities of small trees
(Ruffault and Mouillot, 2015; Hessburg et al., 2016; Andela et al., 2017; Balch et al., 2017; Lasslop and Kloster, 2017; Aragao et al., 2018; Kelley et al., 2019). Globally, 4.2 million km2 of land per year burned on average from 2002 to 2016 (Giglio et al., 2018), with the highest fire frequencies in the Amazon rainforest, deciduous forests and savannas in Africa and deciduous forests in northern Australia (Earl and Simmonds, 2018; Andela et al., 2019).
Since the AR5 and the IPCC Special Report on Land, published research has detected increases in the area burned by wildfire, analysed relative contributions of climate and non-climate factors and attributed burned area increases above natural (recent historical) levels to anthropogenic climate change in one part of the world, western North America (robust evidence, high agreement) (Abatzoglou and Williams, 2016; Partain et al., 2016; Kirchmeier-Young et al., 2019; Mansuy et al., 2019; Bowman et al., 2020). Across the western USA, increases in vegetation aridity due to higher temperatures from anthropogenic climate change doubled burned area from 1984 to 2015 over what would have burned due to non-climate factors including unnatural fuel accumulation from fire suppression, with the burned area attributed to climate change accounting for 49% (32–76%, 95% confidence interval) of cumulative burned area (Abatzoglou and Williams, 2016). Anthropogenic climate change doubled the severity of a southwest North American drought from 2000 to 2020 that has reduced soil moisture to its lowest levels since the 1500s (Williams et al., 2020), driving half of the increase in burned area (Abatzoglou and Williams, 2016; Holden et al., 2018; Williams et al., 2019). In British Columbia, Canada, the increased maximum temperatures due to anthropogenic climate change increased burned area in 2017 to its highest extent in the 1950–2017 record, seven to eleven times the area that would have burned without climate change (Kirchmeier-Young et al., 2019). In Alaska, USA, the high maximum temperatures and extremely low relative humidity due to anthropogenic climate change accounted for 33–60% of the probability of wildfire in 2015, when the area burned was the second highest in the 1940–2015 record (Partain et al., 2016). In protected areas of Canada and the USA, climate factors (temperature, precipitation, relative humidity and evapotranspiration) accounted for 60% of burned area from local human and natural ignitions from 1984 to 2014, outweighing local human factors (population density, roads and built area) (Mansuy et al., 2019).
In summary, field evidence shows that anthropogenic climate change has increased the area burned by wildfire above natural levels across western North America in the period 1984–2017, at GMST increases of 0.6°C–0.9°C, increasing burned area up to 11 times in one extreme year and doubling it (over natural levels) in a 32-year period (high confidence).
2.4.4.2.2 Observed changes in wildfire globally
Regarding global terrestrial area as a whole, wildfire trends vary depending on the time period of analysis. From 1900 to 2000, global average fire frequency, based on field data, increased 0.4% but the change was not statistically significant (Gonzalez et al., 2010). Fire frequency increased on one-third of global land, mainly from burning for agricultural clearing in Africa, Asia and South America, slightly less than the area of fire frequency decrease, mainly from fire suppression across Australia, North America and Russia (Gonzalez et al., 2010). Analyses of the Global Fire Emissions Database document shows that, from 1996 to 2015, global burned area decreased at a rate of −0.7% yr-1 (Forkel et al., 2019) but the change was not statistically significant (Giglio et al., 2013). From 1998 to 2015, global burned area decreased at a rate of −1.4 ± 0.5% yr-1 (Andela et al., 2017). The area of fire increases was one-third of the area of decreases, due to reduced vegetation cover from agricultural expansion and intensification (Andela et al., 2017) and from increased precipitation (Forkel et al., 2019). Furthermore, much of the decreasing trend derives from two years: 1998 with a high burned area and 2013 with low burned area (Forkel et al., 2019). Wildfire does not show a clear long-term trend for the world as a whole because of increases and decreases in different regions (medium evidence, medium agreement).
Where the global average burned area has decreased in the past two decades, higher correlations of rates of change in burning to human population density, cropland area and livestock density than to precipitation indicate that agricultural expansion and intensification were the main causes (Andela et al., 2017). The global decrease of fire frequency from 2000 to 2010 is correlated with increasing human population density (Knorr et al., 2014). The fire-reducing effect of reduced vegetation cover following expansion of agriculture and livestock herding can counteract the fire-increasing effect of the increased heat and drying associated with climate change (Lasslop and Kloster, 2017; Arora and Melton, 2018; Forkel et al., 2019). The reduced burning needed after the initial clearing for agricultural expansion drives much of the decline in fires in the Tropics (Andela et al., 2017; Earl and Simmonds, 2018; Forkel et al., 2019). The human influence on fire ignition can be seen through the decrease documented on holy days (Sundays and Fridays) and traditional religious days of rest (Earl et al., 2015). Overall, human land use exerts an influence on wildfire trends for global terrestrial area as a whole that can be stronger than climate change (medium confidence).
2.4.4.2.3 Observed changes in wildfire in individual regions with complex attribution
While burned area has increased in parts of Asia, Australia, Europe and South America, published research has not yet attributed the increases to anthropogenic climate change (medium evidence, high agreement).
In the Amazon, deforestation for agricultural expansion and the degradation of forests adjacent to deforested areas cause wildfire in moist humid tropical forests not adapted to fire (robust evidence, high agreement) (Fonseca et al., 2017; van Marle et al., 2017; da Silva et al., 2018; da Silva et al., 2021; dos Reis et al., 2021; Libonati et al., 2021). Roads facilitate deforestation, fragmenting the rainforest and increasing the dryness and flammability of vegetation (Alencar et al., 2015). Extreme droughts that occur during warm phases of the ENSO and the Atlantic Multi-Decadal Oscillation combine with the degradation of vegetation to cause extreme fire events (robust evidence, high agreement) (Fonseca et al., 2017; Aragao et al., 2018; da Silva et al., 2018; Burton et al., 2020; dos Reis et al., 2021; Libonati et al., 2021). In the State of Roraima, Brazil, distance to roads and infrastructure that enable deforestation and ENSO were the factors most explaining fire occurrence in the extreme 2015–2016 fire season (Fonseca et al., 2017). From 1973 to 2014, burned area increased in the Amazon, coinciding with increased deforestation (van Marle et al., 2017). In the State of Acre, Brazil, burned area increased 36-fold from 1984 to 2016, with 43% burned in agricultural and livestock settlement areas (da Silva et al., 2018). In the extreme fire year 2019, 85% of the area burned in the Amazon occurred in areas deforested in 2018 (Cardil et al., 2020). Even though relatively higher moisture in 2019 led to burning below the 2002–2019 average across most of South America, burning in areas of recent deforestation in the Amazon were above the 2002–2019 average, indicating that deforestation, not meteorological conditions, triggered the 2019 fires (Kelley et al., 2021; Libonati et al., 2021). Furthermore, from 1981 to 2018, deforestation in the Amazon reduced moisture inputs to the lower atmosphere, increasing drought and fire in a self-reinforcing feedback (Xu et al., 2020). In the Amazon, deforestation exerts an influence on wildfire that can be stronger than climate change (robust evidence, high agreement).
In Australia, burned area increased significantly between the periods1950–2002 and 2003–2020 in the southeast state of Victoria, with the area burned in the 2019–2020 bushfires being the highest on record(Lindenmayer and Taylor, 2020). In addition to the deaths of dozens ofpeople and the destruction of thousands of houses, the 2019–2020bushfires burned almost half of the area protected for conservationin Victoria, two-thirds of the forests allocated for timber harvesting(Lindenmayer and Taylor, 2020), wildlife and extensive areas of habitatfor threatened plant and animal species (Geary et al., 2021). Generally, past timber harvesting did not lead to more severe fire canopy damage(Bowman et al., 2021b). Across southeastern Australia, the fraction of vegetated area that burned increased significantly in eight of the 32 bioregions from 1975 to 2009, but decreased significantly in three bioregions (Bradstock et al., 2014). Increases in four bioregions werecorrelated to increasing temperature and decreasing precipitation.Decreases in burned area occurred despite increased temperatureand decreased precipitation. Analyses of climate across Australia from 1950 to 2017 (Dowdy, 2018; Harris and Lucas, 2019) and during periods with extensive fires in 2017 in eastern Australia (Hope et al.,2019), in 2018 in northeastern Australia (Lewis et al., 2020), and in period 2019–2020 in southeastern Australia (Abram et al., 2021; van Oldenborgh et al., 2021) indicate that temperature and drought extremes due to the ENSO, Southern Annular Mode and other natural inter-decadal cycles drive inter-annual variability of fire weather. While the effects of inter-decadal climate cycles on fire are superimposed on long-term climate change, the relative importance of anthropogenic climate change in explaining changes in burned area in Australia remains unquantified (medium evidence, high agreement).
In Africa, the rate of change of burned area on the continent as a whole ranged from a non-statistically significant −0.45% yr-1 in the period 2002–2016 (Zubkova et al., 2019) to a significant −1.9% yr-1in the period 2001–2016 (Wei et al., 2020). These decreases coincidedwith areas of agricultural expansion or areas where drought reducedfuel loads (Zubkova et al., 2019; Wei et al., 2020). It is possible, however, that the 500-m spatial resolution of Modis remote-sensing fire data underestimates the area burned in Africa by half, by missing small fires (Ramo et al., 2021). In the Serengeti-Mara savanna of eastAfrica, burned area showed no significant change from 2001 to 2014, although an increase in domestic livestock would tend to reduce thegrass cover that fuels savanna fires (Probert et al., 2019).
In Mediterranean Europe, the area burned in the region as a whole decreased from 1985 to 2011 (Turco et al., 2016), although the burned area for Spain did not show a significant long-term increase from 1968 to 2010 (Moreno et al., 2014) whereas that for Portugal in 2017 was the highest in the period 1980–2017 (Turco et al., 2019). Increased summer maximum temperature and decreased soil moisture explained most of the burned area observed, suggesting a contribution of climate change, but fire suppression, fire prevention, agricultural abandonment and reforestation as well as the reduction in forest area exerted even stronger influences on burned area than the climate across Mediterranean Europe (robust evidence, high agreement) (Moreno et al., 2014; Turco et al., 2017; Viedma et al., 2018; Turco et al., 2019).
In the Arctic tundra and boreal forest, where wildfire has naturally been infrequent, burned area showed statistically significant increases of ~50% yr-1 across Siberia, Russia, from 1996 to 2015 (Ponomarev et al., 2016) and 2% yr-1 across Canada from 1959 to 2015 (Hanes et al., 2019). Wildfire burned ~6% of the area of four extensive Arctic permafrost regions in Alaska, USA, eastern Canada and Siberia from 1999 to 2014 (Nitze et al., 2018). In boreal forest in the Northwest Territories, Canada and Alaska, USA, the area burned by wildfire increased at a statistically significant rate of 6.8% yr-1 in the period 1975–2015, (Veraverbeke et al., 2017), with smouldering below-ground fires that lasted through the winter covering ~1% of burned area in the period 2002–2016 (Scholten et al., 2021). While burned area was correlated with temperature and reduced precipitation in Siberia (Ponomarev et al., 2016; Masrur et al., 2018) and correlated with lightning, temperature and precipitation in the Northwest Territories and Alaska (Veraverbeke et al., 2017), no attribution analyses have examined relative influences of climate and non-climate factors.
In Indonesia, deforestation and draining of peat swamp forests dries out the peat, providing substantial fuel for fires (Page and Hooijer, 2016). Extreme fire years in Indonesia, including 1997, 2006 and 2015, coincided with extreme heat and aridity during the warm phase of the ENSO (Field et al., 2016). Fire-resistant forest in 2019 covered only 3% of peatlands and 4.5% of non-peatlands on Sumatra and Kalimantan (Nikonovas et al., 2020).
In Chile, the area burned in the summer of 2016–2017 was 14 times the mean for the period 1985–2016 and the highest on record (Bowman et al., 2019). While this extreme fire year coincided with the highest daily mean maximum temperature in the period 1979–2017 (Bowman et al., 2019) in central Chile (the area of highest fire activity), burned area from 1976 to 2013 showed the highest correlation with the precipitation cycles of the ENSO and the temperature cycles of the Antarctic Oscillation (Urrutia-Jalabert et al., 2018).
Overall, burned area has increased in the Amazon, Arctic, Australia and parts of Africa and Asia, consistent with, but not formally attributed to anthropogenic climate change (medium evidence, high agreement). Deforestation, peat draining, agricultural expansion or abandonment, fire suppression and inter-decadal cycles such as the ENSO exert a stronger influence than climate change on wildfire trends in numerous regions outside of North America (high confidence).
2.4.4.2.4 Observed changes in fire seasons globally
The IPCC AR6 WGI assessed fire weather (Ranasinghe et al., 2021), while this chapter assesses the impacts of changes in fire weather: burned area and fire frequency. The global increases in temperature from anthropogenic climate change have increased aridity and drought, lengthening the fire weather season (the annual period with a heat and aridity index greater than half of its annual range) on one-quarter of global vegetated area and increasing the average fire season length by one-fifth from 1979 to 2013 (Jolly et al., 2015). Climate change has contributed to increases in the fire weather season or the probability of fire weather conditions in the Amazon (Jolly et al., 2015), Australia (Dowdy, 2018; Abram et al., 2021; van Oldenborgh et al., 2021), Canada (Hanes et al., 2019), central Asia (Jolly et al., 2015), East Africa (Jolly et al., 2015) and North America (Jain et al., 2017; Williams et al., 2019; Goss et al., 2020). In forest areas, the burned area correlates with fuel aridity, a function of temperature; in non-forest areas, the burned area correlates with high precipitation in the previous year, which can produce high grass fuel loads (Abatzoglou et al., 2018). Fire use in agriculture and raising livestock or other factors have generated a second fire season on approximately one-quarter of global land where fire is present, despite sub-optimal fire weather in the second fire season (Benali et al., 2017). In summary, anthropogenic climate change, through a 0.9°C surface temperature increase since the pre-industrial period, has lengthened or increased the frequency of periods with heat and aridity that favour wildfire on up to one-quarter of vegetated area since 1979 (robust evidence, high agreement).
2.4.4.2.5 Observed changes in post-fire vegetation
Globally, fire has contributed to biome shifts (Section 2.4.3.2) and tree mortality (Sections 2.4.4.2, 2.4.4.3) attributed to anthropogenic climate change. Research since the AR5 has also found vegetation changes from wildfire due to climate change. Through increased temperature and aridity, anthropogenic climate change has driven post-fire changes in plant regeneration and species composition in South Africa (Slingsby et al., 2017), and tree regeneration in the western USA (Davis et al., 2019b). In the fynbos vegetation of the Cape Floristic Region, South Africa, post-fire heat and drought and the legacy effects of exotic plant species reduced the regeneration of native plant species, decreasing species richness by 12% from 1966 to 2010 and shifting the average temperature tolerance of species communities upward by 0.5°C (Slingsby et al., 2017). In burned areas across the western USA, the increasing heat and aridity of anthropogenic climate change from 1979 to 2015 pushed low-elevation ponderosa pine (Pinus ponderosa) and Douglas fir (Pseudotsuga menziesii) forests across critical thresholds of heat and aridity that reduced the post-fire tree regeneration by half (Davis et al., 2019b). In the southwestern USA, where anthropogenic climate change has caused drought (Williams et al., 2019) and increased wildfire (Abatzoglou and Williams, 2016), high-severity fires have converted some forest patches to shrublands (Barton and Poulos, 2018). Field evidence shows that anthropogenic climate change and wildfire, together, altered vegetation species composition in the southwestern USA and Cape floristic region, South Africa, reducing post-fire natural regeneration and species richness of tree and other plant species, between 1966 and 2015, at GMST increases of 0.3°C–0.9°C (medium evidence, high agreement).
Working Group II: Chapter 2 (Terrestrial and Fresh Water Ecosystems and Their Services)
Here is reproduced, with likely formatting errors, the section
P247-248: 2.4.4.2 FAQ 2.3 Is climate change increasing wildfire?
In the Amazon, Australia, North America, Siberia and other regions, wildfires are burning wider areas than in the past. Analyses show that human-caused climate change has driven the increases in burned area in the forests of western North America. Elsewhere, deforestation, fire suppression, agricultural burning and short-term cycles like El Niño can exert a stronger influence than climate change. Many forests and grasslands naturally require fire for ecosystem health but excessive wildfire can kill people, destroy homes and damage ecosystems.
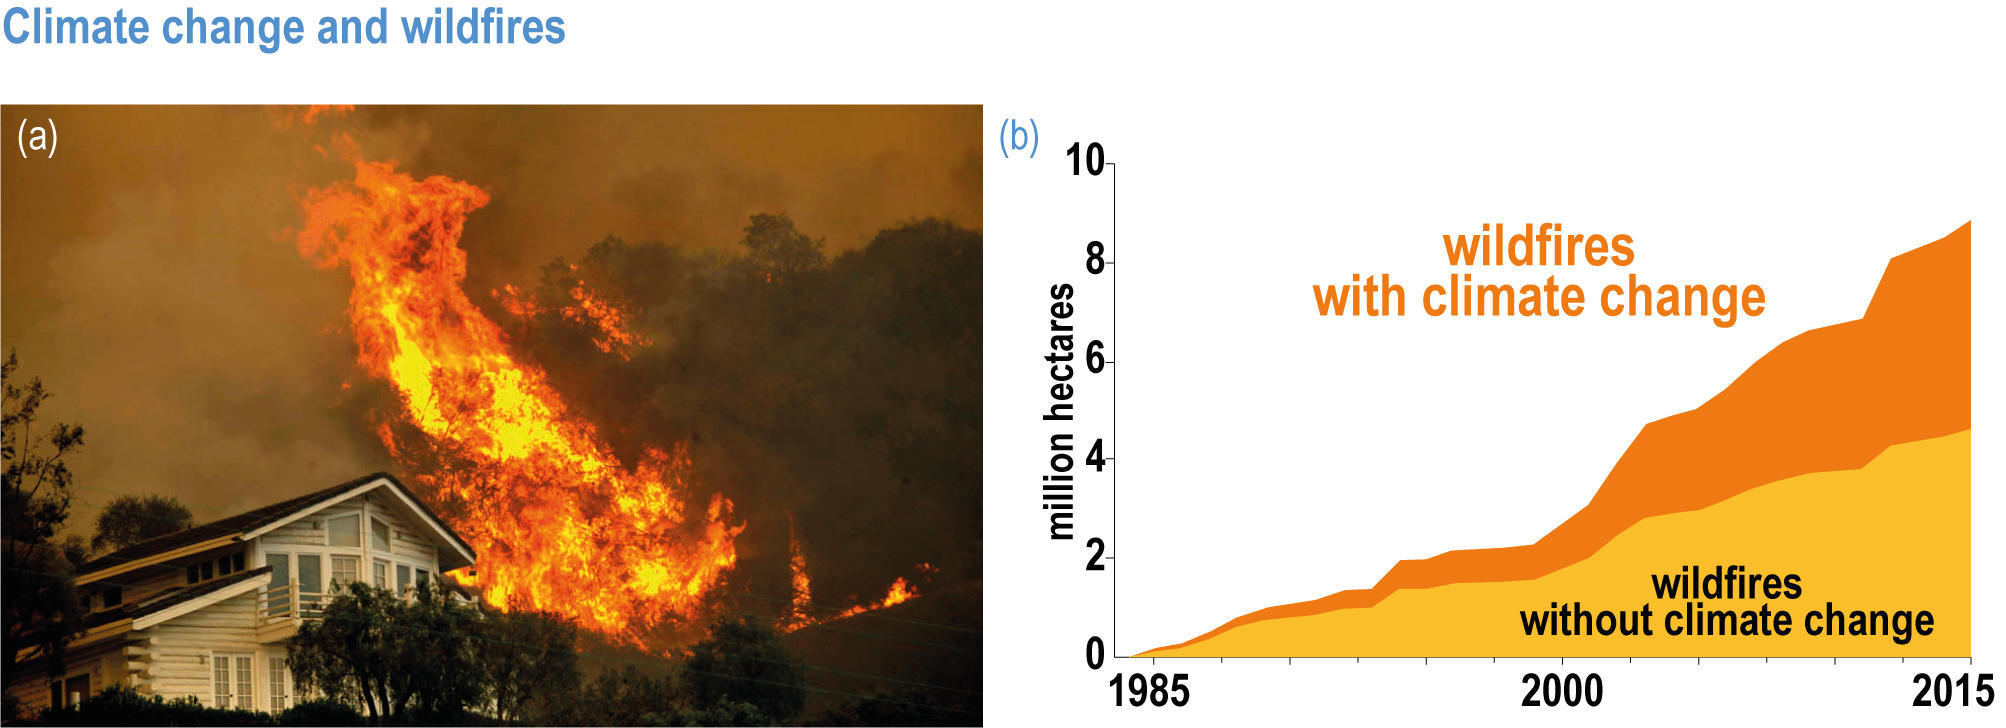
Figure FAQ2.3.1 | (a) Springs Fire, May 2, 2013, Thousand Oaks, California, USA (photo by Michael Robinson Chávez, Los Angeles Times). (b) Cumulative area burned by wildfire in the western USA, with (orange) and without (yellow) the increased heat and aridity of climate change.
Wildfire is a natural and essential part of many forest, woodland and grassland ecosystems, killing pests, releasing plant seeds to sprout, thinning out small trees and serving other functions essential for ecosystem health. Excessive wildfire, however, can kill people with the smoke causing breathing illnesses, destroy homes (Figure FAQ2.3.1a) and damage ecosystems.
Human-caused climate change increases wildfire by intensifying its principal driving factor, heat. The heat of climate change dries out vegetation and accelerates burning. Non-climate factors also cause wildfires. Agricultural companies, small-scale farmers and livestock herders in many tropical areas cut down forests and intentionally set fires to clear fields and pastures. Cities, towns and roads increase the number of fires that people ignite. Governments in many countries suppress fires, even natural ones, producing unnatural accumulations of fuel in the form of coarse woody debris and dense stands of small trees. The fuel accumulations cause particularly severe fires that burn upwards into tree crowns.
Evidence shows that human-caused climate change has driven increases in the area burned by wildfire in the forests of western North America. Across this region, the higher temperatures of human-caused climate change doubled burned area from 1984 to 2015, compared with what would have burned without climate change (Figure FAQ2.3.1b). The additional area burned, 4.9 million hectares, is greater than the land area of Switzerland. Human-caused climate change drove a drought from 2000 to 2020 that has been the most severe since the 1500s, severely increasing the aridity of vegetation. In British Columbia, Canada, the higher maximum temperatures of human-caused climate change increased burned area in 2017 to its widest extent in the 1950–2017 record, seven to eleven times the area that would have burned without climate change. Moreover, in national parks and other protected areas of Canada and the USA, most of the area burned from 1984 to 2014 can be attributed to climate factors (temperature, rainfall and aridity) and these outweigh local human factors (population density, roads and urban area).
In other regions, wildfires are also burning wider areas and occurring more often. This is consistent with climate change, but analyses have not yet shown if climate change is more important than other factors. In the Amazon, deforestation by companies, farmers and herders who cut down and intentionally burn rainforests to expand agricultural fields and pastures causes wildfires even in relatively moister years. Drought exacerbates these fires. In Australia, much of the southeastern part of the continent has experienced extreme wildfire years, but analyses suggest that El Niño, a heat phenomenon that cycles up and down periodically, is more important than long-term climate change. In Indonesia, intentional burning of rainforests for oil palm plantations and El Niño seem to be more important than long-term climate change. In Mediterranean Europe, fire suppression seems to have prevented any increasing trend in burned area but the suppression and abandonment of agricultural lands have allowed fuel to build up in some areas and contribute to major fires in years of extreme heat. In Canada and Siberia, wildfires are now burning more often in permafrost areas where fire was rare, but analyses are lacking regarding the relative influence of climate change. For the world as a whole, satellite data indicate that the vast amount of land converted from forest to farmland in the period 1998–2015 actually decreased the total burned area. Nevertheless, the evidence from the forests of western North America shows that human-caused climate change has, at least on one continent, clearly driven increases in wildfire.
Other material from
Working Group II: Chapter 2 (Terrestrial and Fresh Water Ecosystems and Their Services)
is extracted below.
Working Group II: Technical summary
This is every sentence with “fire” in it. No commentary.
Observed Impacts
P44: TS.B Observed Impacts
Regional increases in temperature, aridity and drought have increased the frequency and intensity of fire. The interaction between fire, land use change, particularly deforestation, and climate change, is directly impacting human health, ecosystem functioning, forest structure, food security and the livelihoods of resource-dependent communities.
P45: TS.B.1
Climate change has caused local species losses, increases in disease (high confidence) and mass mortality events of plants and animals (very high confidence), resulting in the first climate-driven extinctions (medium confidence), ecosystem restructuring, increases in areas burned by wildfire (high confidence) and declines in key ecosystem services (high confidence).
P46 – 47: Figure TS.3
P47: TS.B.1.4
Woody plant expansion into grasslands and savannahs, linked to increased CO2, has reduced grazing land, while invasive grasses in semiarid lands increased the risk of fire (high confidence).
P47: TS.B.2
Widespread and severe loss and damage to human and natural systems are being driven by human-induced climate changes increasing the frequency and/or intensity and/or duration of extreme weather events, including droughts, wildfires, terrestrial and marine heatwaves, cyclones (high confidence) and flood (low confidence).
P48: TS.B.2.2
Some extreme events have already emerged which exceeded projected global mean warming conditions for 2100, leading to abrupt changes in marine and terrestrial ecosystems (high confidence). For some forest types an increase in the frequency, severity and duration of wildfires and droughts has resulted in abrupt and possibly irreversible changes (medium to high confidence).
P48: TS.B.2.3
Climate-related extremes have affected the productivity of agricultural, forestry and fishery sectors (high confidence). Droughts, floods, wildfires and marine heatwaves contribute to reduced food availability and increased food prices, threatening food security, nutrition and livelihoods of millions of people across regions (high confidence).
P48: TS.B.2.4
Since AR5, the impacts of climate change and extreme weather events such as wildfires, extreme heat, cyclones, storms and floods have adversely affected or caused loss and damage to human health, shelter, displacement, incomes and livelihoods, security and inequality (high confidence).
P50: TS.B.4.5
Climate-induced changes in the hydrological cycle have negatively impacted freshwater and terrestrial ecosystems.
Fire risks have increased due to heat and drought conditions in many parts of the world (medium confidence).
P52: TS.B.5.9
Several chronic, non-communicable respiratory diseases are climate-sensitive based on their exposure pathways (e.g., heat, cold, dust, small particulates, ozone, fire smoke and allergens (high confidence),although climate change is not the dominant driver in all cases. Exposure to wildfires and associated smoke has increased in several regions (very high confidence). The 2019–2020 southeastern Australian wildfires resulted in the deaths of 33 people, a further 429 deaths and 3230 hospitalisations due to TS cardiovascular or respiratory conditions and $1.95 billion in health costs. Spring pollen season start dates in northern mid-latitudes are occurring earlier due to climate change, increasing the risks of allergic respiratory diseases (high confidence).
P53: TS.B.8
Sea level rise, heatwaves, droughts, changes in runoff, floods, wildfires and permafrost thaw cause disruptions of key infra- structure and services such as energy supply and transmission, communications, food and water supply and transport systems in and between urban and peri-urban areas (high confidence).
P54: TS.B.9.2
Wildfires partly attributed to climate change have caused substantial economic damage in recent years in North America, Australia and the Arctic (high confidence).
Projected Impacts and Risks
P55: TS.C.1.2
At a global warming of 2°C with associated changes in precipitation global land area burned by wildfire is projected to increase by 35% (medium confidence).
P56: TS.C.1.4
Increases in wildfires, tree mortality, insect pest outbreaks, peatland drying and permafrost thaw (high confidence) all exacerbate self-reinforcing feedbacks between emissions from high-carbon ecosystems and warming with the potential to turn many ecosystems that are currently net carbon sinks into sources (medium confidence).
P56: TS.C.2.1
If these pressures are not successfully addressed, the combined and interactive effects between climate change, deforestation and forest degradation, and forest fires are projected to lead to a reduction of over 60% of the area covered by forest in response to 2.5°C global warming level (medium confidence).
P57: TS.C.2.2
Pests, weeds and disease occurrence and distribution are projected to increase with global warming, amplified by climate change induced extreme events (e.g., droughts, floods, heatwaves and wildfires), with negative consequences for ecosystem health, food security, human health and livelihoods (medium confidence).
P57: TS.C.2.3
The ability of natural ecosystems to provide carbon stor- age and sequestration is increasingly impacted by heat, wildfire, droughts, loss and degradation of vegetation from land use and other impacts (high confidence). Limiting the global temperature increase to 1.5°C, compared to 2°C, could reduce projected permafrost CO2 losses by 2100 by 24.2 GtC (low confidence). A temperature rise of 4°C by 2100 is projected to increase global burned area 50–70% and fire frequency by approx. 30%, potentially releasing 11–200 GtC from the Arctic alone (medium confidence).
P58-60: Figure TS.4
P61: TS.C.4.3
Increased wildfire, combined with soil erosion due to deforestation, could degrade water supplies (medium confidence).
P62: TS.C.4.4
More droughts and extreme fire weather are projected in southern and eastern Australia (high confidence) and over most of New Zealand (medium confidence).
P67: TS.C.11.3
Compound hazards increasing with global warming include increased frequency of concurrent heatwaves and droughts (high confidence), dangerous fire weather (medium confidence) and floods (medium confidence), resulting in increased and more complex risks to agriculture, water resources, human health, mortality, livelihoods, settlements and infrastructure.
P68: TS.C.11.8
Indigenous Peoples, traditional communities, small- holder farmers, urban poor, children and elderly in Amazonia are burdened by cascading impacts and risks from the compound effects of climate and land use change on forest fires in the region (high confidence). Deforestation, fires and urbanisation have increased the exposure of Indigenous Peoples to respiratory problems, air pollution and diseases (high confidence). Amazonian forest fires are transboundary and increase systemic losses of wild crops, infrastructure and livelihoods, requiring a landscape governance approach (medium evidence, high agreement).
P68: TS.C.13.2
Overshoot substantially increases risk of carbon stored in the biosphere being released into the atmosphere due to increases in processes such as wildfires, tree mortality, insect pest outbreaks, peatland drying and permafrost thaw (high confidence).
P69 – 70: Table TS.1 Updated assessment of risk level transitions for the five reasons for concern (RFC)
RFC2 Extreme weather events: risks/ impacts to human health, livelihoods, assets and ecosystems from extreme weather events such as heatwaves, heavy rain, drought and associated wildfires and coastal flooding.
Increased heat-related human mortality, wildfires, agricultural and ecological droughts, water scarcity; short-term food shortages; impacts on food security and safety, price spikes; marine heatwaves estimated to double in frequency.
P76-78: Figure TS.7 (Part 1)
P76-78: Figure TS.7 (Part 2)
P76-78: Figure TS.7 (Part 3)
P82-83: Figure TS.10 (PART 1)
P82-83: Figure TS.10 (PART 2)
Adaptation Progress and Gaps
P86: TS.D.4.1
Ecosystem-based adaptation is being increasingly advocated in coastal defence against storm surges, terrestrial flood regulation, reducing urban heat and restoring natural fire regimes.
P87: TS.D.4.2
Adaptation also includes actions to prevent the impacts of extreme events or aid the recovery of ecosystems following extreme events, such as wildfire, drought or marine heatwaves.
P87: TS.D.4.5
Ecosystem-based adaptation measures can reduce climatic risks to people, including from flood, drought, fire and overheating (high confidence).
Restoring natural vegetation cover and wildfire regimes can reduce risks to people from catastrophic fires.
Climate Resilient Development
P109: TS.E.4.3
Tropical rainforests and global peatlands are particularly important carbon stores but are highly threatened by human disturbance, land conversion and fire.
Working Group II: Chapter 16 (Key Risks across Sectors and Regions)
This chapter integrates other parts of the report and has more than 20 mentions of wildfire. Open the PDF and search for “wildfire” to find out what it says.
Here is what is stated about wildfire from Working Group II Frequently Asked Questions
FAQ1: What are the new insights on climate impacts, vulnerability and adaptation from IPCC.
Changes in temperature, rainfall, and extreme weather have also increased the frequency and spread of diseases in wildlife, agriculture, and people. We see a lengthening wildfire season and increases in the area burned. Roughly half of the world’s population currently experiences severe water shortages at some point during the year, in part due to climate change and extreme events such as flooding and droughts. Drought conditions have become more frequent in many regions, negatively affecting agriculture and energy production from hydroelectric power plants.
People living in cities nowadays face higher risks of heat stress, reduced air quality because of wildfire, lack of water, food shortages and other impacts caused by climate change and its effect on supply chains, transport networks and other critical infrastructure. Globally, climate change is increasingly causing injuries, illness, malnutrition, threats to physical and mental health and well-being, and even deaths. It is making hot areas even hotter and drastically reducing the time people can spend outside, which means that some outdoor workers cannot work the required hours and thus will earn less.
This is from FIRE-RES an EU funded project focused on extreme wildfire events.
Material from
Working Group II: Chapter 2 (Terrestrial and Fresh Water Ecosystems and Their Services), other than P243-246: 2.4.4.2 Observed Changes in Wildfire is extracted here. P243-246: 2.4.4.2 Observed Changes in Wildfire is presented above in this post.
Observed Impacts
P201: Since AR5, biome shifts and structural changes within ecosystems have been detected at an increasing number of locations, consistent with climate change and increasing atmospheric CO2 (high confidence).
A combination of changes in grazing, browsing, fire, climate and atmospheric CO2 is leading to observed woody encroachment into grasslands and savannah, consistent with projections from process-based models driven by precipitation, atmospheric CO2 and wildfires (high confidence)
P201: Regional increases in the area burned by wildfire (up to double natural levels), tree mortality of up to 20%, and biome shifts of up to 20 km latitudinally and 300 m up-slope have been attributed to anthropogenic climate change in tropical, temperate and boreal ecosystems around the world (high confidence), damaging key aspects of ecological integrity.
P201: Fire seasons have lengthened on one-quarter of vegetated areas since 1979 as a result of increasing temperature, aridity and drought (medium confidence). Field evidence shows that anthropogenic climate change increased area burned by wildfire above natural levels in western North America in the period 1984–2017: a doubling above natural for the western USA and 11 times higher than natural in one extreme year in British Columbia (high confidence). In the Amazon, the Arctic, Australia and parts of Africa and Asia, burned area has increased, consistent with, although not formally attributed to, anthropogenic climate change. Wildfires generate up to one-third of ecosystem carbon emissions globally, a feedback that exacerbates climate change (high confidence). Deforestation, draining of peatlands, agricultural expansion or abandonment, fire suppression, and inter-decadal cycles such as the El Niño-Southern Oscillation (ENSO), can exert a stronger influence than climate change on increasing or decreasing wildfire in some regions {2.4.4.2; Table 2.3; Table SM2.1; FAQ 2.3}. Increase in wildfire from the levels to which ecosystems are adapted degrades vegetation, habitat for biodiversity, water supplies and other key aspects of the integrity of ecosystems and their ability to provide services for people (high confidence). The direction of changes in carbon balance and wildfires following insect outbreaks depends on the local forest insect communities (medium confidence). Projected Risks P202: Climate change increases risks to fundamental aspects of ter- restrial and freshwater ecosystems, with the potential for spe- cies’ extinctions to reach 60% at 5°C global mean surface air temperature (GSAT) warming (high confidence), biome shifts (changes in the major vegetation form of an ecosystem) on 15% (at 2°C warming) to 35% (at 4°C warming) of global land (medium confidence), and increases in the area burned by wild- fire of 35% (at 2°C warming) to 40% (at 4°C warming) of glob- al land (medium confidence). P202: The risk of wildfire increases along with an increase in global temperatures (high confidence). With 4°C GSAT warming by 2100, wildfire frequency is projected to have a net increase of ~30% (medium confidence). Increased wildfire, combined with soil erosion due to deforestation, could degrade water supplies (medium confidence). For ecosystems with an historically low frequency of fires, a projected 4°C global temperature rise increases the risk of fires, with potential increases in tree mortality and the conversion of extensive parts of the Amazon rainforest to drier and lower-biomass vegetation (medium confidence). P202: Continued climate change substantially increases the risk of carbon stored in the biosphere being released into the atmosphere due to increases in processes such as wildfire, tree mortality, insect pest outbreaks, peatland drying and permafrost thaw (high confidence). Contributions of Adaptation Measures to Solutions P203: There is new evidence that species can persist in refugia where conditions are locally cooler, when populations of the same species may be declining elsewhere (high confidence) {2.6.2}. Protecting refugia, for example, where soils remain wet during drought or fire risk is reduced, and in some cases creating cooler micro-climates, are promising adaptation measures {2.6.3; 2.6.5; Cross-Chapter Paper 1; CCP5.2.1} P203: Ecosystem-based adaptation (EbA) can deliver climate change adaptation for people, with multiple additional benefits including those for biodiversity (high confidence). An increasing body of evidence demonstrates that climatic risks to people including floods, drought, fire and overheating, can be lowered by a range of EbA techniques in urban and rural areas (medium confidence). P204: Natural ecosystems can provide the storage and sequestration of carbon at the same time as providing multiple other ecosystem services, including EbA (high confidence), but there are risks of maladaptation and environmental damage from some approaches to land-based mitigation (high confidence). Plantation, single-species forests in areas which would not naturally support forest, including savanna, natural grasslands and temperate peatlands, and replacing native tropical forests on peat soils, have destroyed local biodiversity and created a range of problems regarding water supply, food supply, fire risk and GHG emissions. P205: Risk assessments for species, communities, key ecosystems and their services were based on the risk assessment framework introduced in the IPCC AR5 (IPCC, 2014b). Assessments of observed changes in biological systems emphasise detecting and attributing the impacts of climate change on ecological and evolutionary processes, particularly freshwater ecosystems, and ecosystem processes such as wildfires, that were superficially assessed in previous reports. Where appropriate, assessment of interactions between climate change and other human activities is provided. Observed Changes to Hazards and Extreme Events P208: However, climate changes, disturbance regime changes and the magnitude and frequency of extreme events such as floods, droughts, cyclones, heat waves and fire have increased in many regions (high confidence). P208: Increases in the frequency and severity of heat waves, droughts and aridity, floods, fires and extreme storms have been observed in many regions (Seneviratne et al., 2012; Ummenhofer and Meehl, 2017), and these trends are projected to continue (high confidence) P217: Heat waves in Siberia in 2016, 2018 and 2020, with air temperature anomalies >6°, were associated with extensive wildfires, pest infestations and melting permafrost (Overland and Wang, 2021). P217: The impact appears to be greater when extreme events occur more frequently, particularly when the interval between events is insufficient to allow recovery to previous population sizes (e.g., frequent fires and coral bleaching) or coincides with vulnerable life-cycle stages, even when populations are adapted to cope with such disturbances. P217: Monitoring following extreme events can help identify immediate impacts and the potential for cascading interactions, such as changes to competitive interactions following range shifts, impacts on freshwater ecosystems following wildfires and the spread of invasive species. P237: 2.4.3 Observed Changes in Key Biomes, Ecosystems and Their Services 2.4.3.1 Detection and Attribution for Observed Biome Shifts However, other biomes, such as many grassland systems, are not in equilibrium with climate (Bond et al., 2005). In these systems, their evolutionary history (Keeley et al., 2011; Strömberg, 2011; Charles-Dominique et al., 2016), distribution, structure and function have been shaped by climate and natural disturbances, such as fire and herbivory (Staver et al., 2011; Lehmann et al., 2014; Pausas, 2015; Bakker et al., 2016; Malhi et al., 2016). Disturbance variability is an inherent characteristic of grassland systems, and suitable ‘control’ conditions are seldom available in nature. Furthermore, due to the integral role of disturbance, these biomes have been widely affected by long-term and widespread shifts in grazing regimes, large-scale losses of mega-herbivores and fire suppression policies P238: 2.4.3.2.2 Observed biome shifts from combined land use change and climate change Research has detected biome shifts in areas where agriculture, fire use or suppression, livestock grazing, harvesting of timber and wood for fuel and other local land use substantially altered vegetation, in addition to changes in climatic factors and CO2 fertilisation. These studies were not designed or conducted in a manner to make climate change attribution possible, although many vegetation changes are consistent with climate change. For example, a global review of observed changes in tree lines found that, globally, two-thirds of tree lines have shifted upslope in elevation over the past 50 years or more, ((Hansson et al., 2021). P238: Intentional use of fire drove an upslope forest shift in Peru (Bush et al., 2015) while mainly human-ignited fires drove the conversion of shrubland to grassland in a drought-affected area of the USA (Syphard et al., 2019b). In eastern Canada, timber harvesting and wildfire drove the conversion of mixed conifer–broadleaf forests to broadleaf-dominated forests (Brice et al., 2020; Wang et al., 2020b). P238: Globally, overgrazing initiates shrub encroachment by reducing grasses more than woody plants, while fire exclusion maintains the shrub cover (D’Odorico et al., 2012; Caracciolo et al., 2016; Bestelmeyer et al., 2018). P238: 2.4.3.3 Observed Changes in Deserts and Arid Shrublands While observed responsiveness of arid vegetation productivity to rising atmospheric CO2 (Fensholt et al., 2012) may offset risks from reduced water availability (Fang et al., 2017), climate- and CO2-driven changes are key risks in arid regions, interacting with habitat degradation, wildfires and invasive species (Hurlbert et al., 2019). P238: In the eastern semi-desert (Karoo) of South Africa, annual rainfall increases and a rainfall seasonality shift (du Toit and O’Connor, 2014) are increasing grassiness as arid grasslands expand into semi-desert shrublands (du Toit et al., 2015; Masubelele et al., 2015b; Masubelele et al., 2015a) causing fire in areas seldom burned historically (Coates et al., 2016). P239: 2.4.3.4 Observed Changes in Mediterranean-Type Ecosystems MTEs (Mediterranean-type Ecosystems) show a range of direct responses to various forms of water deficit, but have also been affected by increasing fire activity linked to drought (Abatzoglou and Williams, 2016), and interactions between drought or extreme weather and fire affecting post-fire ecosystem recovery (Slingsby et al., 2017). P239: Remote-sensing studies show drought-associated mortality in post-fire vegetation regrowth in the Fynbos of South Africa (Slingsby et al., 2020b), reduced canopy health in forests within MTE zones of South Africa (Hope et al., 2014) and declines in canopy water content in the forests of California (Asner et al., 2016a). P239: More frequent extreme hot and dry weather between 1966 and 2010 caused a decline in diversity during the post-fire regeneration phase in the Fynbos of South Africa (Slingsby et al., 2017), resulting in shifts towards species with higher temperature preferences (Slingsby et al., 2017). P239: In southern California, USA, areas of forest and woody shrublands are shifting to grasslands, driven by a combination of climate and land use factors such as increased drought, fire ignition frequency and increases in nitrogen deposition (robust evidence, high agreement) P239: The effects of climate change on heat, fuel and wildfire ignition limits show spatial and temporal variation globally (see Section 2.3.6.1), but there have been a number of observed impacts on MTEs (medium evidence, high agreement). Climate change caused increases in fuel aridity and the area of land burned by wildfires across the western USA from 1985 to 2015 (Abatzoglou and Williams, 2016). Local and global climatic variability led to a 4-year decrease in the average fire return time in the Fynbos, South Africa, when comparing fires recorded in 1951–1975 and 1976–2000 (Wilson et al., 2010). In Chile, González et al. (2018) reported a significant increase in the number, size, duration and simultaneity of large fires during the 2010–2015 ‘megadrought’ when compared to the 1990–2009 baseline. P240: 2.4.3.5 Observed Changes in Savanna and Grasslands Direct quantification of climate-change drivers is confounded with local LUC such as fire suppression (Archibald, 2016; Venter et al., 2018), heavy grazing (du Toit and O’Connor, 2014; Archer et al., 2017), removal of native browsers and, specifically, loss of mega-herbivores in Africa (medium evidence, medium agreement) (Asner et al., 2016b; Daskin et al., 2016; Stevens et al., 2016; Davies et al., 2018). P240: 2.4.3.6 Observed Changes in Tropical Forest Interactions of LULCCs such as land abandonment, grazing management shifts and fire suppression with climate change are contributing factors (Liu et al., 2021) P240: The tree line shifts that have occurred are probably driven by interactions between changing land use (e.g., fire suppression) and climate changes such as increased rainfall, warming and elevated CO2 (via CO2 fertilisation or increases in water-use efficiency) (medium evidence, medium agreement) P240: Declines in productivity are most strongly associated with warming (Sullivan et al., 2020), reduced growth rates during droughts (Bennett et al., 2015; Bonai et al., 2016; Corlett, 2016), drought-related mortality (Brando et al., 2014; Zhou et al., 2014; Brienen et al., 2015; Corlett, 2016; McDowell et al., 2018), fire (Liu et al., 2017) and cloud-induced P241: Climate change continues to degrade forests by reducing resilience to pests and diseases, increasing species invasion, facilitating pathogen spread (Malhi et al., 2014; Deb et al., 2018) and intensifying fire risk and potential dieback (Lapola et al., 2018; Marengo et al., 2018). Drought, temperature increases and forest fragmentation interact to increase the prevalence of fires in tropical forests (robust evidence, high agreement). Warming increases water stress in trees (Corlett, 2016) and, together with forest fragmentation, dramatically increases the desiccation of forest canopies—resulting in deforestation that then leads to even hotter and drier regional climates (Malhi et al., 2014; Lewis et al., 2015). Warming and drought increase the invasion of grasses into forest edges and increase fire risk (robust evidence, high agreement) (Brando et al., 2014; Balch et al., 2015; Lewis et al., 2015). Droughts and fires additively increase mortality and, consequently, reduce canopy cover and above-ground biomass (Cross-Chapter Paper 7) (Brando et al., 2014, 2020; Balch et al., 2015; Lewis et al., 2015). P241: 2.4.3.7 Observed Changes in Boreal and Temperate Forests The AR5 found increased tree mortality, wildfire and plant phenology changes in boreal and temperate forests (Settele et al., 2014). Expanding on these conclusions, this assessment, using analyses of causal factors, attributes the following observed changes in boreal and temperate forests in the 20th and 21st centuries to anthropogenic climate change: upslope and poleward biome shifts at sites in Asia, Europe and North America (Section 2.4.3.2.1); range shifts of plants (Section 2.4.2.1); earlier blooming and leafing of plants (Section 2.4.2.4); poleward shifts in tree-feeding insects (Section 2.4.2.1); increases in insect pest outbreaks (Section 2.4.4.3.3); increases in the area burned by wildfire in western North America (Section 2.4.4.2.1); increased drought-induced tree mortality in western North America (Section 2.4.4.3.1); and thawing of the permafrost that underlies extensive areas of boreal forest (Section 2.4.3.9)(Section 2.3.2.5 in (Gulev et al., 2021)). Atmospheric CO2 from anthropogenic sources has also increased net primary productivity (NPP) (Section 2.4.4.5.1). In summary, anthropogenic climate change has caused substantial changes in temperate and boreal forest ecosystems, including biome shifts and increases in wildfire, insect pest outbreaks and tree mortality, at a global mean surface temperature (GMST) increase of 0.9°C above the pre-industrial period (robust evidence, high agreement). Other changes detected in boreal forests and consistent with, but not formally attributed to, climate change, include increased wildfire in Siberia (Section 2.4.4.2.3), long-lasting smouldering below-ground fires in Canada and the USA (Scholten et al., 2021), tree mortality in Europe (Section 2.4.4.3.3) and post-fire shifts of boreal conifer to deciduous broadleaf tree species in Alaska (Mack et al., 2021). From 1930 to 1960, boreal forest growth became limited more by precipitation than temperature in the Northern Hemisphere (Babst et al., 2019). For some vegetation, changes in land use and management have exerted more influence than climate change. These include upslope and poleward forest shifts in Europe following the abandonment of timber harvesting or livestock grazing (Section 2.4.3.2.2), changes in wildfire in Europe affected by fire suppression, fire prevention and agricultural abandonment (Section 2.4.4.2.3), and forest species composition changes in Scotland due to nitrogen deposition from air pollution (Hester et al., 2019). Remote sensing suggests that the area of temperate and boreal forests increased in Asia and Europe between 1982 and 2016 (Song et al., 2018) and in Canada between 1984 and 2015 (Guindon et al., 2018), but forest plantations and regrowth are probable drivers (Song et al., 2018). P241-242: 2.4.3.8 Observed Changes in Peatlands Globally, peatland ecosystems store approximately 25% (600 ± 100 GtC) of the world’s soil organic carbon (Yu et al., 2010; Page et al., 2011; Hugelius et al., 2020) and 10% of the world’s freshwater resources (Joosten and Clarke, 2002), despite only occupying 3% of the global land area (Xu et al., 2018a). The long-term role of northern peatlands in the carbon cycle was mentioned for the first time in IPCC AR4 (IPCC, 2007), while SR1.5 briefly mentioned the combined effects of changes in climate and land use on peatlands (IPCC, 2018b). New evidence confirms that climate change, including extreme weather events (e.g., droughts; Section 8.3.1.6), permafrost degradation (Section 2.3.2.5), SLR (Section 2.3.3.3) and fire (Section 5.4.3.2) (Henman and Poulter, 2008; Kirwan and Mudd, 2012; Turetsky et al., 2015; Page and Hooijer, 2016; Swindles et al., 2019; Hoyt et al., 2020; Hugelius et al., 2020; Jovani-Sancho et al., 2021; Veraverbeke et al., 2021), superimposed on anthropogenic disturbances (e.g., draining for agriculture or mining; Section 5.2.1.1), has led to rapid losses of peatland carbon across the world (robust evidence, high agreement) (Page et al., 2011; Leifeld et al., 2019; Hoyt et al., 2020; Turetsky et al., 2020; Loisel et al., 2021). Other essential peatland ecosystem services, such as water storage and biodiversity, are also being lost worldwide (robust evidence, high agreement) (Bonn et al., 2014; Martin-Ortega et al., 2014; Tiemeyer et al., 2017). The switch from carbon sink to carbon source in peatlands globally is mainly attributable to changes in the depth of the water table, regardless of management or status (robust evidence, high agreement) (Lafleur et al., 2005; Dommain et al., 2011; Lund et al., 2012; Cobb et al., 2017; Evans et al., 2021; Novita et al., 2021). Across the temperate and tropical biomes, extensive drainage and deforestation have caused widespread water table draw-downs and/or peat subsidence, as well as high CO2 emissions (medium evidence, high agreement). Climate change is compounding these impacts (medium evidence, medium agreement). For example, in Indonesia, the highest emissions from drained tropical peatlands were reported in the extremely dry year of the 1997 El Ni.o (810–2570 TgC yr-1) (Page et al., 2002) and the 2015 fire season (380 TgC yr-1) (Field et al., 2016). These prolonged dry seasons have also led to tree die-offs and fires, which are relatively new phenomena at these latitudes (medium evidence, high agreement) (Cole et al., 2015; Mezbahuddin et al., 2015; Fanin and van der Werf, 2017; Taufik et al., 2017; Cole et al., 2019). Low soil moisture contributes to increased fire propagation (Section 12.4.2.2) (Dadap et al., 2019; Canadell et al., 2021), causing long-lasting fires responsible for smoke and haze pollution (robust evidence, high agreement) (Ballhorn et al., 2009; Page et al., 2009; Gaveau et al., 2014; Huijnen et al., 2016; Page and Hooijer, 2016; Hu et al., 2018; Vadrevu et al., 2019; Niwa et al., 2021). Increases in fires and smoke lead to habitat loss and negatively impact regional faunal populations (limited evidence, high agreement) (Neoh et al., 2015; Erb et al., 2018b; Thornton et al., 2018). In large, lowland tropical peatland basins that are less impacted by anthropogenic activities (i.e., the Amazon and Congo river basins), the direct impact of climate change is that of a decreased carbon sink (limited evidence, medium agreement) (Roucoux et al., 2013; Gallego-Sala et al., 2018; Wang et al., 2018a; Dargie et al., 2019; Ribeiro et al., 2021). As for the temperate and boreal regions, climatic drying also tends to promote peat oxidation and carbon loss to the atmosphere (medium evidence, medium agreement) (Section 2.3.1.3.4) (Helbig et al., 2020; Zhang et al., 2020). In Europe, increasing mean annual temperatures in the Baltic, Scandinavia, and continental Europe (Section 12.4.5.1) have led to widespread lowering of peatland water tables at intact sites (Swindles et al., 2019), desiccation and die-off of sphagnum moss (Bragazza, 2008; Lees et al., 2019) and increased intensity and frequency of fires, resulting in a rapid carbon loss (Davies et al., 2013; Veraverbeke et al., 2021). Nevertheless, longer growing seasons and warmer, wetter climates have increased carbon accumulation and promoted thick deposits regionally, as reported for some North American sites (limited evidence, medium agreement) (Cai and Yu, 2011; Shiller et al., 2014; Ott and Chimner, 2016). In high-latitude peatlands, the net effect of climate change on the permafrost peatland carbon sink capacity remains uncertain (Abbott et al., 2016; McGuire et al., 2018b; Laamrani et al., 2020; Loisel et al., 2021; Sim et al., 2021; V.liranta et al., 2021). Increasing air temperatures have been linked to permafrost degradation and altered hydrological regimes (2.3.3.2; Figure 2.4a; 2.4.3.9; Box 5.1), which have led to rapid changes in plant communities and bio-geochemical cycling (robust evidence, high agreement) (Liljedahl et al., 2016; Swindles et al., 2016; Voigt et al., 2017; Zhang et al., 2017b; Voigt et al., 2020; Sim et al., 2021). In many instances, permafrost degradation triggers thermokarst land subsidence associated with local wetting (robust evidence, high agreement) (Jones et al., 2013; Borge et al., 2017; Olvmo et al., 2020; Olefeldt et al., 2021). Permafrost thaw in peatland-rich landscapes can also cause local drying through increased hydrological connectivity and runoff (Connon et al., 2014). In the first decades following thaw, increases in methane, CO2 and nitrous oxide emissions have been recorded from peatland sites, depending on surface moisture conditions (Schuur et al., 2009; O’Donnell et al., 2012; Elberling et al., 2013; Matveev et al., 2016; Euskirchen et al., 2020; Hugelius et al., 2020). Conversely, some evidence suggests increased peat accumulation after thaw (Jones et al., 2013; Estop-Aragon.s et al., 2018; V.liranta et al., 2021). There is also a need to consider the impact of wildfire on permafrost thaw, due to its effect on soil temperature regime (Gibson et al., 2018), as fire intensity and frequency have increased across the boreal and Arctic biomes (limited evidence, high agreement) (Kasischke et al., 2010; Scholten et al., 2021). The CO2 emissions from degrading peatlands is contributing to climate change in a positive feedback loop (robust evidence, high agreement). At mid-latitudes, widespread anthropogenic disturbance led to large historical GHG emissions and current legacy emissions of 0.15 PgC yr-1 between 1990 and 2000 (limited evidence, high agreement) (Maljanen et al., 2010; Tiemeyer et al., 2016; Drexler et al., 2018; Qiu et al., 2021). About 80 million hectares of peatland have been converted to agriculture, equivalent to 72 PgC emissions in 850–2010 CE (Leifeld et al., 2019; Qiu et al., 2021). In Southeast Asia (SEA), an estimated 20–25 Mha of peatlands have been converted to agriculture with carbon currently being lost at a rate of ~155 ± 30 MtC yr−1 (Miettinen et al., 2016; Leifeld et al., 2019; Hoyt et al., 2020). Extensive deforestation and drainage have caused widespread peat subsidence and large CO2 emissions at a current average of ~10 ± 2 tonnes ha-1 yr-1, excluding fires (Hoyt et al., 2020), with values estimated from point subsidence measurements being as high as 30–90 tonnes CO2 ha−1 yr−1 locally (robust evidence, high agreement) (W.sten et al., 1997; Matysek et al., 2018; Swails et al., 2018; Evans et al., 2019; Conchedda and Tubiello, 2020; Anshari et al., 2021). On average, at the global scale, increases in GHG emissions from peatlands have primarily come from the compounded effects of LUC, drought and fire, with additional emissions from some thawing-permafrost peatlands (robust evidence, high agreement).